

Volume 13, Issue 3 (Summer 2025)
Iran J Health Sci 2025, 13(3): 221-232 |
Back to browse issues page


Ethics code: IR.GOUMS.REC.1402.127
Clinical trials code: https://ethics.research.ac.ir/ IR.GOUMS.REC.1402.127. .
Download citation:
BibTeX | RIS | EndNote | Medlars | ProCite | Reference Manager | RefWorks
Send citation to:


BibTeX | RIS | EndNote | Medlars | ProCite | Reference Manager | RefWorks
Send citation to:
Babanezhad M, khorshah H, mohajervatan A. A Comparative Study of Road Traffic Mortality Rates Using Time Series Forecasting Models. Iran J Health Sci 2025; 13 (3) :221-232
URL: http://jhs.mazums.ac.ir/article-1-1018-en.html
URL: http://jhs.mazums.ac.ir/article-1-1018-en.html


Department of Statistics, Faculty of Sciences, Golestan University, Gorgan, Iran. , m.babanezhad@gu.ac.irhoo.com
Keywords: Time series, Road traffic accidents (RTAs), Forecasting, Propensity score matching (PSM), Autoregressive integrated moving average (ARIMA)
Full-Text [PDF 1253 kb]
(986 Downloads)
| Abstract (HTML) (1825 Views)
Full-Text: (456 Views)
Introduction
Road traffic accidents (RTAs) are a major global health challenge, accounting for approximately 1.19-1.3 million deaths each year. Alarmingly, 93% of these deaths occur in low- and middle-income countries, even though these countries own only 60% of the world’s vehicles [1-6]. Iran is among the countries with a high mortality rate from RTAs, with nearly 16,000 lives lost annually. The accidents are especially prevalent in high-traffic areas of the country, like the roads of northern provinces, where poor road conditions, frequent traffic violations, and insufficient law enforcement exacerbate the incidence of RTAs [6-8]. The consequences of these accidents, in addition to death, include physical disabilities, emotional trauma, and financial burdens on families and the healthcare system [7-12]. Contributing factors include human error (e.g. exceeding speed), vehicle defects, inadequate infrastructure, and environmental hazards [13-17].
While prior studies have examined risk factors and policies for RTAs, critical gaps still remain, including a lack of comparative urban-suburban analyses [5-15] and insufficient attention to temporal trends [18-22]. A comparative analysis of RTAs and related mortality rates between urban and suburban areas provides essential insights into disparities in risk factors, infrastructural challenges, and policy requirements. However, most studies rely on cross-sectional data, missing seasonal variations and long-term patterns that can enhance efforts to prevent accidents [7-10, 21-25]. Time-series data, though underutilized, offers valuable predictive insights into accident dynamics [21-29]. For instance, urban areas may experience peak RTAs during rush hours due to congestion, whereas suburban fatalities might surge on weekends or holidays as a result of high-speed driving. Forecasting models can predict these fluctuations, enabling tailored traffic control measures for each setting. Similarly, suburban roads, which are often less maintained than urban roads, may see a higher RTA-related mortality rate during adverse weather conditions such as rainy or snowy days. Additionally, urban and suburban expansion may alter accident rates over time. Forecasting models can help planners to anticipate future risks and optimize infrastructure development before the occurrence of accidents. However, few studies have used advanced forecasting methods such as multiple logistic regression (MLR), the autoregressive integrated moving average (ARIMA), and propensity score matching (PSM) models [29-31] to analyze urban and suburban RTA trends closely.
This study addresses these gaps by analyzing temporal trends of RTAs in Golestan Province, north of Iran, providing evidence for better traffic management and emergency response. This study aims to explore various aspects of RTA mortality rates resulting in urban and suburban areas of the province using MLR, ARIMA, and PSM forecasting models. The MLR model is useful for studying how confounding factors relate to a binary response variable, such as mortality across urban and suburban areas. The ARIMA model provides insights into temporal trends and patterns of mortality across urban and suburban regions. We also employed the semi-parametric PSM method to identify comparable features between urban and suburban areas. This involves distinguishing groups based on their propensity score (PS), which are defined as random effects within a mixed-effects model. The novelty of this study is the integration of PSM with a time-series data framework, offering a fresh perspective on forecasting RTA mortality rates across urban and suburban areas. The key questions are: What are the differences in RTA mortality rates between urban and suburban areas? How can the proposed forecasting models help in decision-making for staffing in emergency response centers in urban and suburban areas? Which model is more effective for forecasting RTA mortality rates in these areas?
Materials and Methods
Study design and data
This retrospective cohort study was carried out using the RTA data (n=37,409) reported by Emergency Medical Services (EMS 115) from March 2021 to March 2023 in Golestan Province, located in northeast Iran. The inclusion criteria were cases such as RTAs injuries that need medical care, fatalities at the scene, dangerous situations, and mass casualty events. On the other hand, the exclusion criteria were the cases that are usually not recorded by the EMS 115, such as minor accidents without injuries, medical emergencies not related to traffic, non-urgent transportation, and incidents not occurring on the road.
This study measured multiple factors related to RTA scenarios, including age and gender of the individual involved in the accident, the duration between the ambulance being dispatch and its arrival at the scene (D1), the duration between receiving the message and the ambulance’s arrival at the treatment center (D2), peripheral oxygen saturation level (SPO2) at the time of accident, location of accident (urban or suburban area), year of accident (from March 2021 to March 2023), month of accident, and time of accident (daytime or nighttime). Descriptive statistical methods were utilized to summarize the data, including calculations of Mean±SD.
Forecasting methods
We used forecasting models MLR, ARIMA, and PSM within a time-series data framework. Although MLR and PSM are not conventionally standard models for time-series forecasting, they can be effectively applied to analyze the time-series data. The ARIMA model excels in forecasting continuous time series, while the MLR model is suited for classification tasks. The choice depends on whether the focus is prediction of values (ARIMA) or probabilities (MLR) and how well temporal dependencies are handled. For rigorous time-series classification, extending MLR with autoregressive terms or PSM model may be necessary, because, the MLR method may involve the inclusion of lagged variables to tackle autocorrelation by accounting for the temporal structure [29-31]. Regarding the PSM model, it is essential to consider time-related confounding factors such as age, SPO2, and gender; and also, potentially match within time strata or employ time-dependent covariates [31]. We apply these three different models to our dataset and assess their performance using the root mean square error (RMSE) and the mean absolute percentage error (MAPE) criteria [22]. These two errors criteria are calculated as Equations 1 and 2:
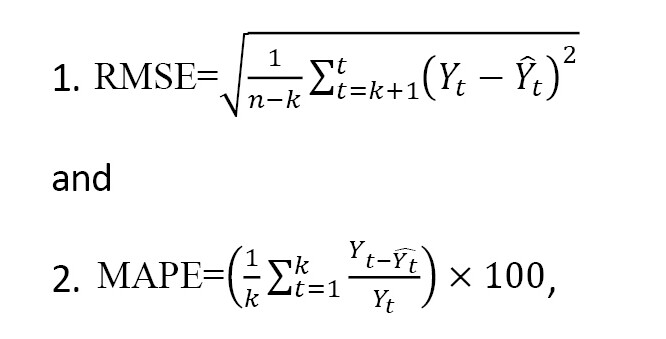
where Yt and are the observed and predicted values, respectively, for all time t, n is the total number of observations and k is the samples size (k ARIMA model
ARIMA is a popular time-series model designed for forecasting using historical data. It extends the ARMA model by including differencing, making it suitable for non-stationary data. If no differencing is needed (d=0), ARIMA reduces to ARMA. While ARMA works specifically with stationary time series, ARIMA is tailored for handling non-stationary ones. This model helps to identify and forecast trends over time, providing a temporal context that is crucial for understanding how urban/suburban area development and increased vehicle numbers affect RTA rates. By applying the ARIMA model, researchers analyze temporal patterns, which are crucial for understanding the influence of the two above-mentioned factors on RTA rates over time. Conducting residual diagnostics is crucial for evaluating the validity of the ARIMA model, ensuring that the residuals exhibit independence. For this purpose, the Ljung-box portmanteau test was utilized to assess the adequacy of the fitted ARIMA model. This statistical test is based on the autocorrelation of the squared residuals. The Ljung-box portmanteau test statistic is calculated as Equation 3:
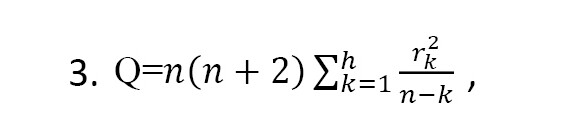
where n is the total number of observations, h is the number of lags to include in the test, and rk indicates the sample autocorrelation coefficients at lag k. The test statistic Q follows a chi-square distribution with h-w degrees of freedom where h is the number of lags the test is computed for and w is the number of parameters used in fitting the model. Our data consists of information spanning two years. This data is regarded as a sample, and the calculated rk at different lags (k=1, 2, …, h) represents the sample autocorrelation of the residuals. The range of their variation is (-1, 1). To perform the Ljung-box test, we first determine the sample autocorrelations rk for the specified lags up to h. We assess the P; if the P>0.05, it confirms the null hypothesis, indicating that the residuals do not have significant autocorrelation and that the ARIMA model is appropriate. In contrast, if the P<0.05, we reject the null hypothesis, suggesting that significant autocorrelation exists in the residuals, and the ARIMA model is inappropriate.
The Ljung-box portmanteau test results of our study revealed that the residuals from our fitted ARIMA model do not exhibit significant autocorrelation, supporting the model’s adequacy for the time-series data. They follow an ARIMA (p, d, q) model, where p represents the Autoregressive order, d denotes the number of differencing steps applied to the data to achieve stationarity, and q signifies the Moving Average order. Our dataset was non-stationary. By applying a single time difference (d=1), we transformed it into stationary data. Subsequently, we generated plots for the autocorrelation function and the partial autocorrelation function to determine the suitable orders p and q. Consequently, we concluded that our data was well-suited for the ARIMA (1, 1, 1) model. Finaly, differentiating the autoregressive moving average model (ARIMA) (1, 1, 1) using the Ljung-box test, it was significant (P>0.05). The key advantage of the Ljung-box test is that it helps assess whether the model has adequately captured the structure of the data or whether significant patterns remain unexplained.
MLR model
The MLR model analyzes the impact of multiple independent variables on a binary outcome (e.g. accident outcome such as survival/death), allowing researchers to control for confounding factors. This approach can be adjusted for time-series analysis, particularly when the outcome is binary and time-dependent, and the predictors involve lagged variables [29]. The model is described as Equation 4:
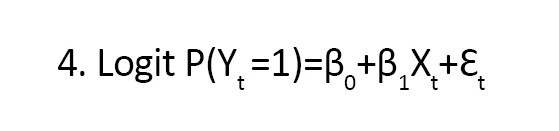
Where Yt is the actual observed response variable (death or survival), Xt is the set of explanatory variables, and Ԑt is the error term at time t.
PSM method
PSM is a semi-parametric approach that matches groups with similar attributes, enabling a more accurate prediction of RTAs. This method distinguishes between urban and suburban areas based on their PS, which are treated as random effects in a mixed-effects model. By identifying and matching similar characteristics among different groups, this method aims to reduce selection bias and enhance the validity of comparisons. This estimation technique allows for the examination of data over time (longitudinal data setting), which is important for capturing changes in RTA rates relative to urban growth and policy changes. This innovative combination allows for a more nuanced understanding of the factors influencing RTAs, facilitating comparisons across different urban and suburban contexts. In such instances, it is essential to ensure that the distribution of covariates such as SPO2 is balanced at each time point.
We used the PS derived from the Cox proportional hazards model, which is employed in risk set matching. We employed the PS to predict RTA mortality rates. The outcome was binary; 1 (death) or 0 (survival), determined by factors including D1, D2, age, gender, SPO2, location (urban, suburban), year, month, and time factors. Logistic regression was employed, and the nearest neighbor matching technique was applied in this context [31]. Then, individuals were matched to assess mortality risks among comparable risk profiles (e.g. high-SPO2 vs low-SPO2 groups). In the regression model, the variable was considered 0 or 1 (survival or death), while other factors were confounding factors. Our analysis demonstrated that matching based on the PS successfully achieved a balanced distribution of covariates between individuals who died and those who survived after RTAs.
Data analysis
The statistical analysis was carried out in R software, version 4.5.0. To evaluate differences in demographic characteristics and RTA injuries between urban and suburban areas, independent t-test was employed, while the chi-square test was used to examine difference in categorical variables. P<0.05 was considered statistically significant.
Results
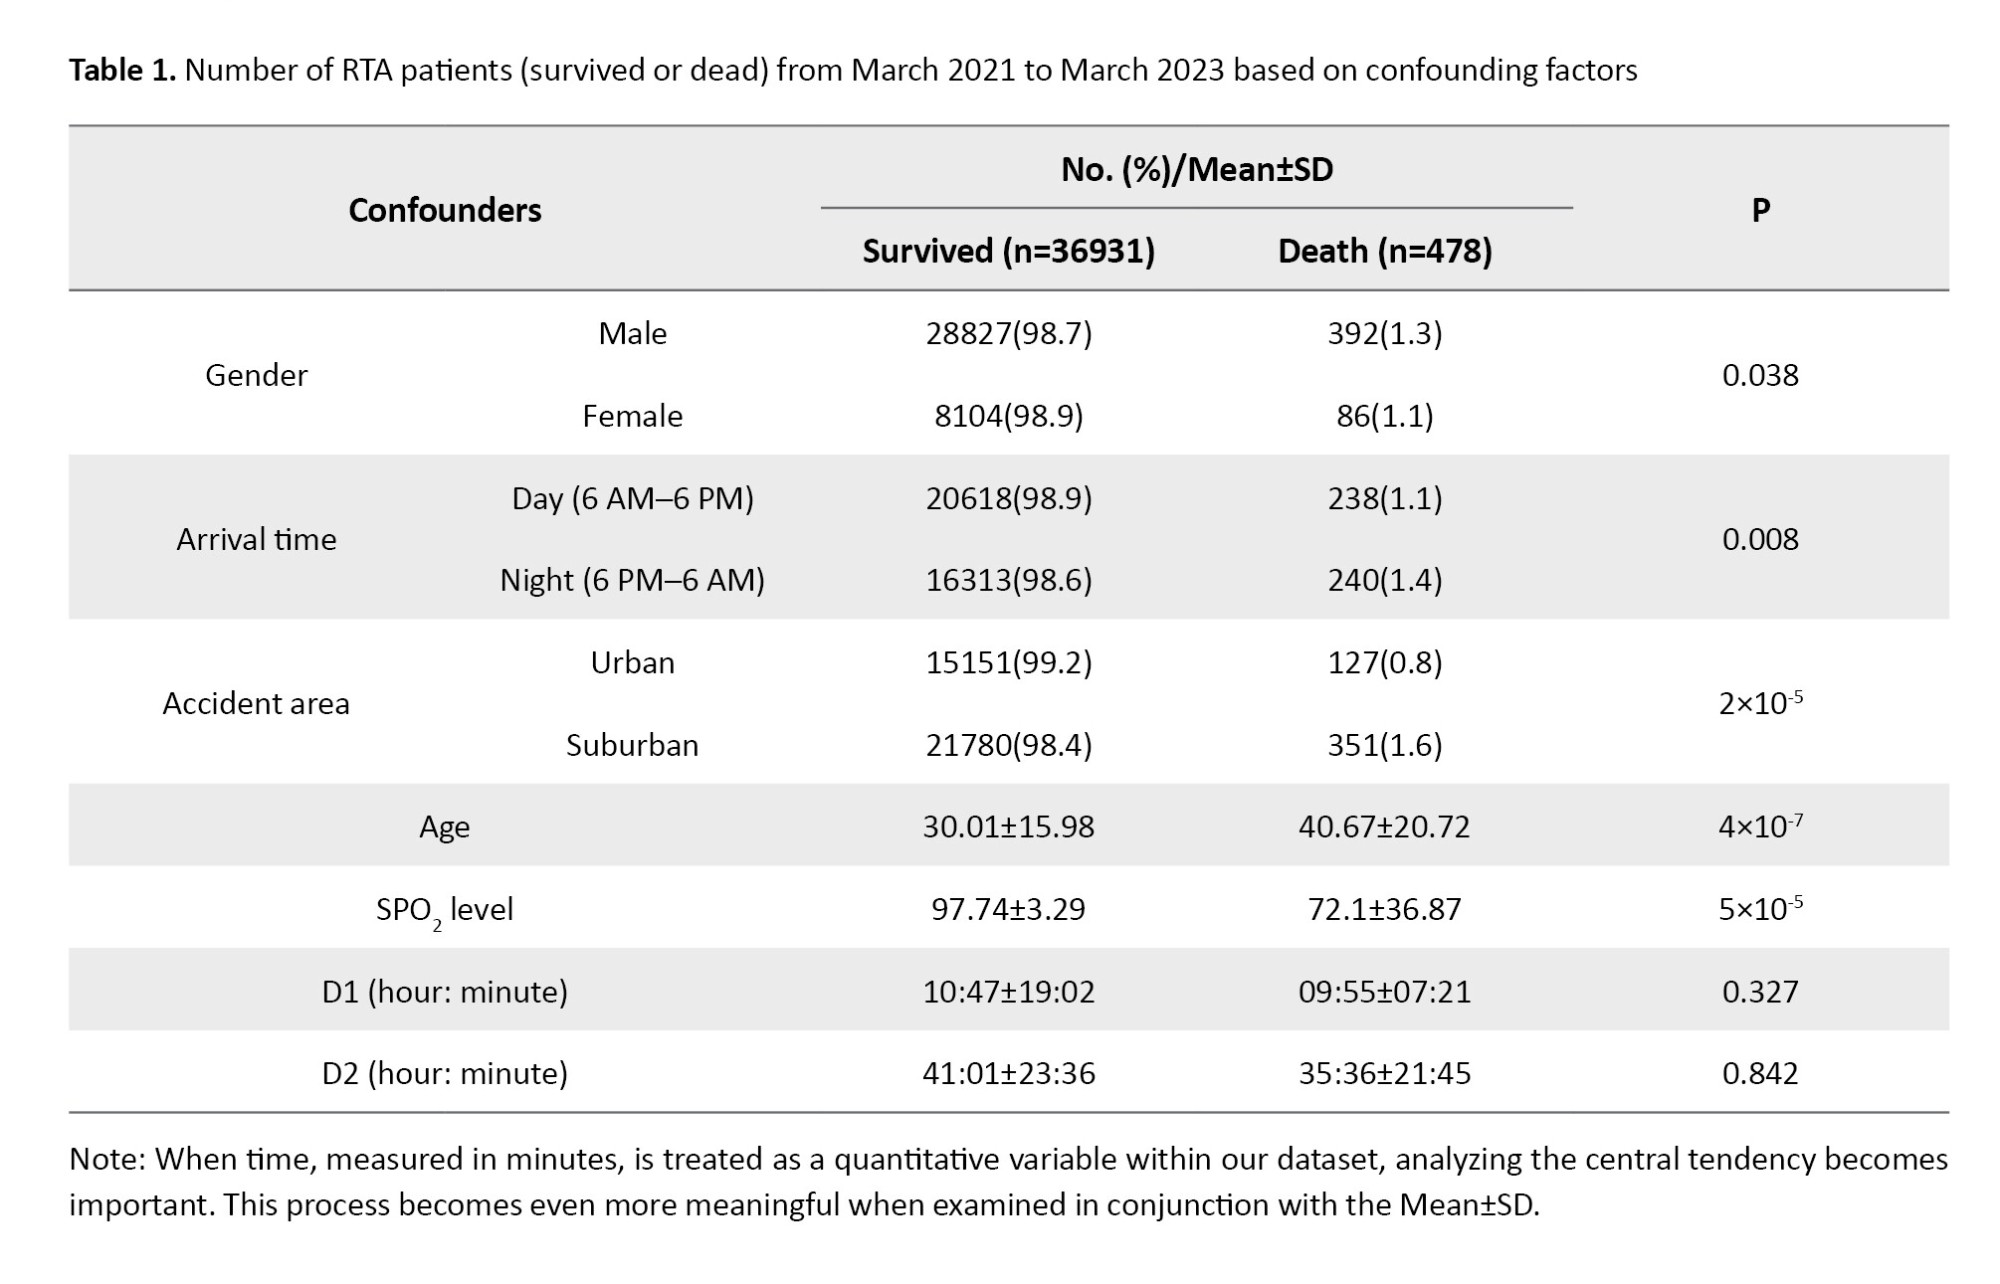
This study analyzed 37,409 records of RTAs collected from March 2021 to March 2023. As shown in Table 1, the survival rate was 98.7% (n=36931) and only 1.3% (n=478) led to death. The mortality rate of RTAs occurred in suburban areas was twice the rate in urban areas (1.6% vs 0.8%). The accidents happened more at daytime, while the mortality rate was higher for RTAs occurred at nighttime (P=0.008). Also, most of accidents occurred in suburban areas than in urban areas. The age of deceased individuals was significantly higher than that of survivors, while their mean SPO2 level was lower than that of survivors. Moreover, there was a statistically significant difference between men and women (P=0.038), where men experienced more RTAs compared to women.
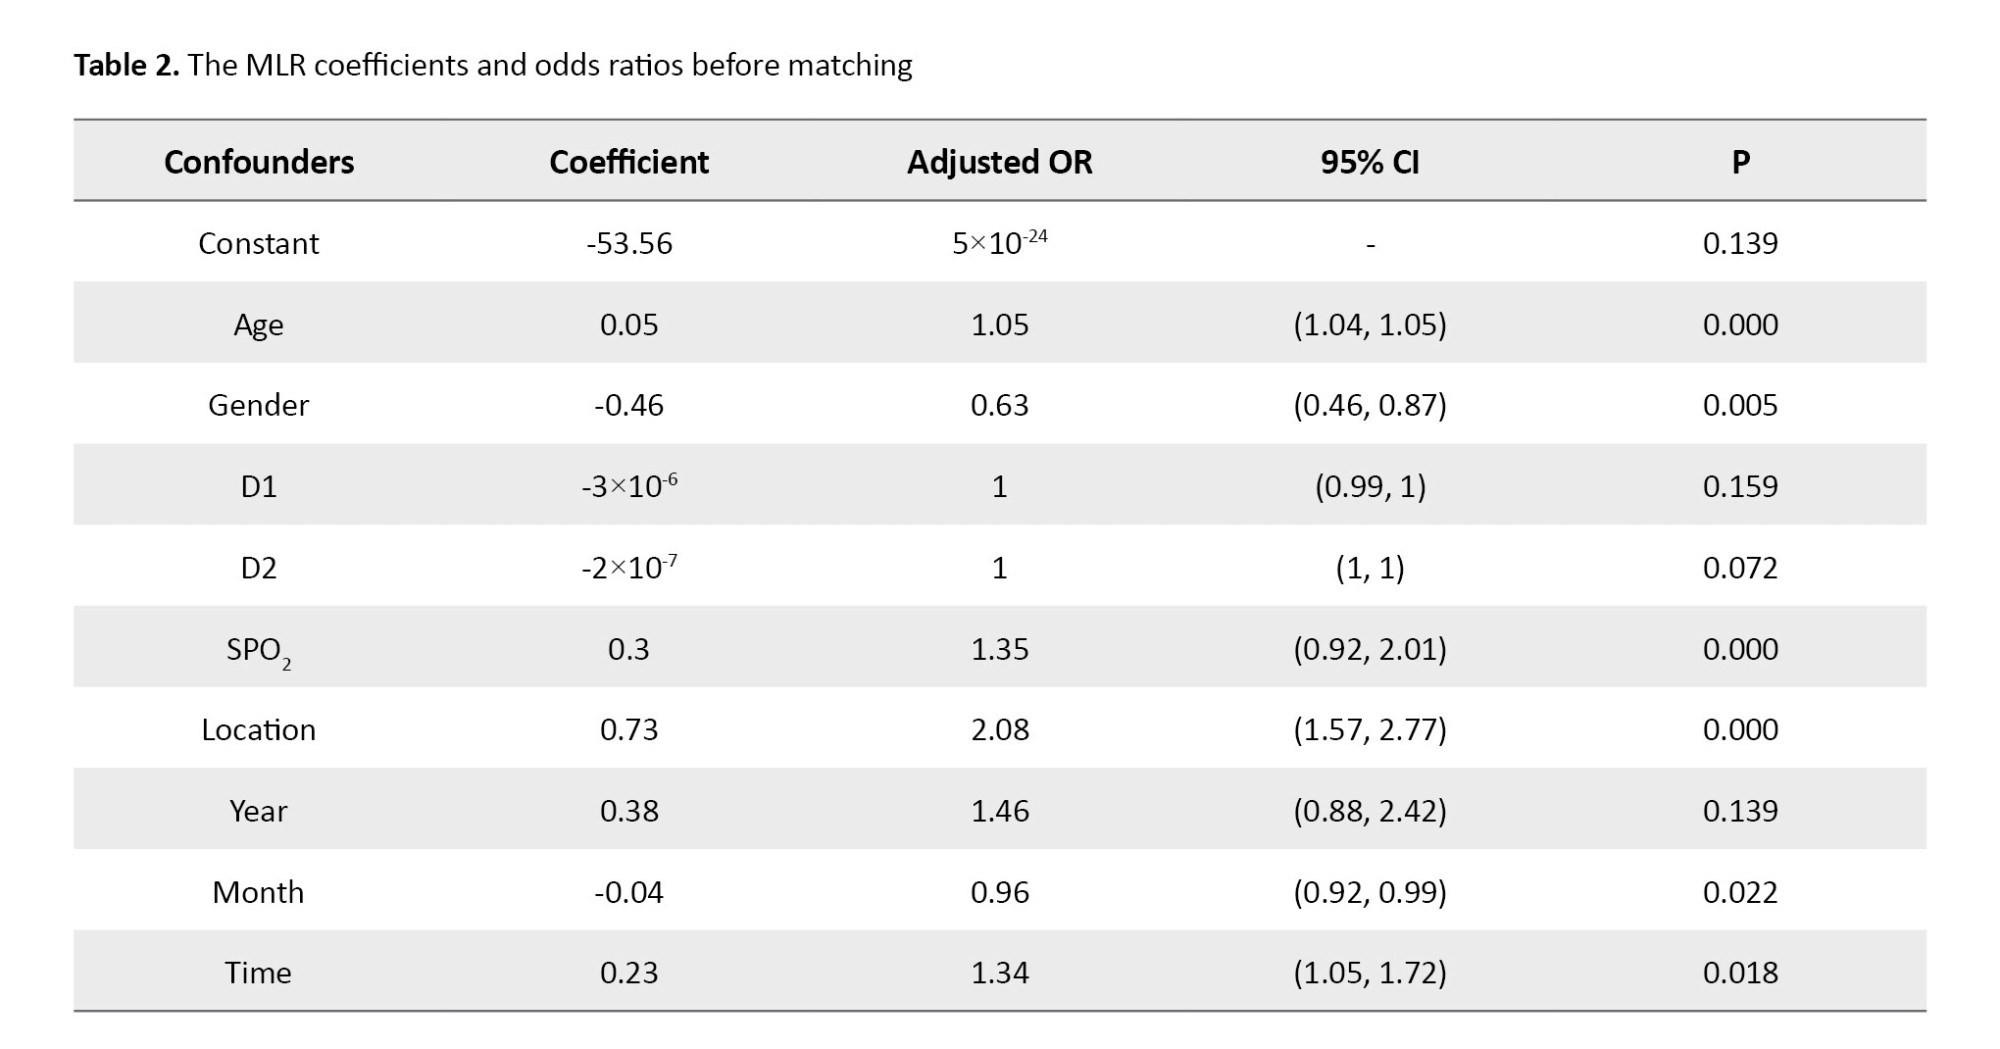
The results of MLR before PSM presented in Table 2 indicated the statistically significant association of RTA mortality rate with age, gender, D2, SPO2 level, location, month, and the time of the accident (daytime vs. nighttime) (P<0.05). Additionally, the analysis reveals that a decrease in SPO2 is associated with a 35% increase in the risk of RTA mortality. Furthermore, males have 37% lower odds of RTA mortality rate compared to females (OR=0.63, 95% CI, 0.46%, 0.87%). Location of accident predicted a change by 2.08 units in RTA mortality rate (OR=2.08, 95% CI, 1.57%, 2.77%). The year of accident predicted the risk of RTA mortality rate by 46%. The time of accidents predicted the risk of RTA mortality rate by 1.34 units.
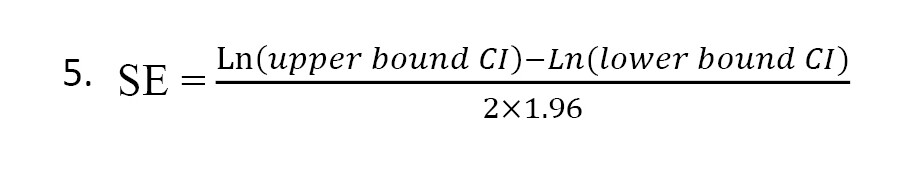
The standard error (SE) in the estimated effect size (log-odds coefficients) for all covariates can be derived from the ORs at 95% CI as Equation 5:
We used the PSM method to analyze RTA data while adjusting for four non-modifiable confounders, which were selected since the emergency center was unable to modify them and also due to their significant baseline differences (P<0.05). Table 3 shows the PSM results for the distance (convergence metric) and confounders between the death and survival groups before and after successful matching. The mean values for distance and confounders showed improved balance and a substantial reduction in the standardized mean difference (from 0.52 for the total dataset to 6×10⁻⁴ in the matched dataset), confirming the algorithm’s effectiveness in matching of the characteristics of the two groups. This approach in fact allows for a more equitable comparison by pairing patients with similar characteristics, thereby minimizing biases that could affect the mortality [30, 31]. It should be noted that, the nearest neighbor matching technique was utilized to create a balanced comparison between two groups.
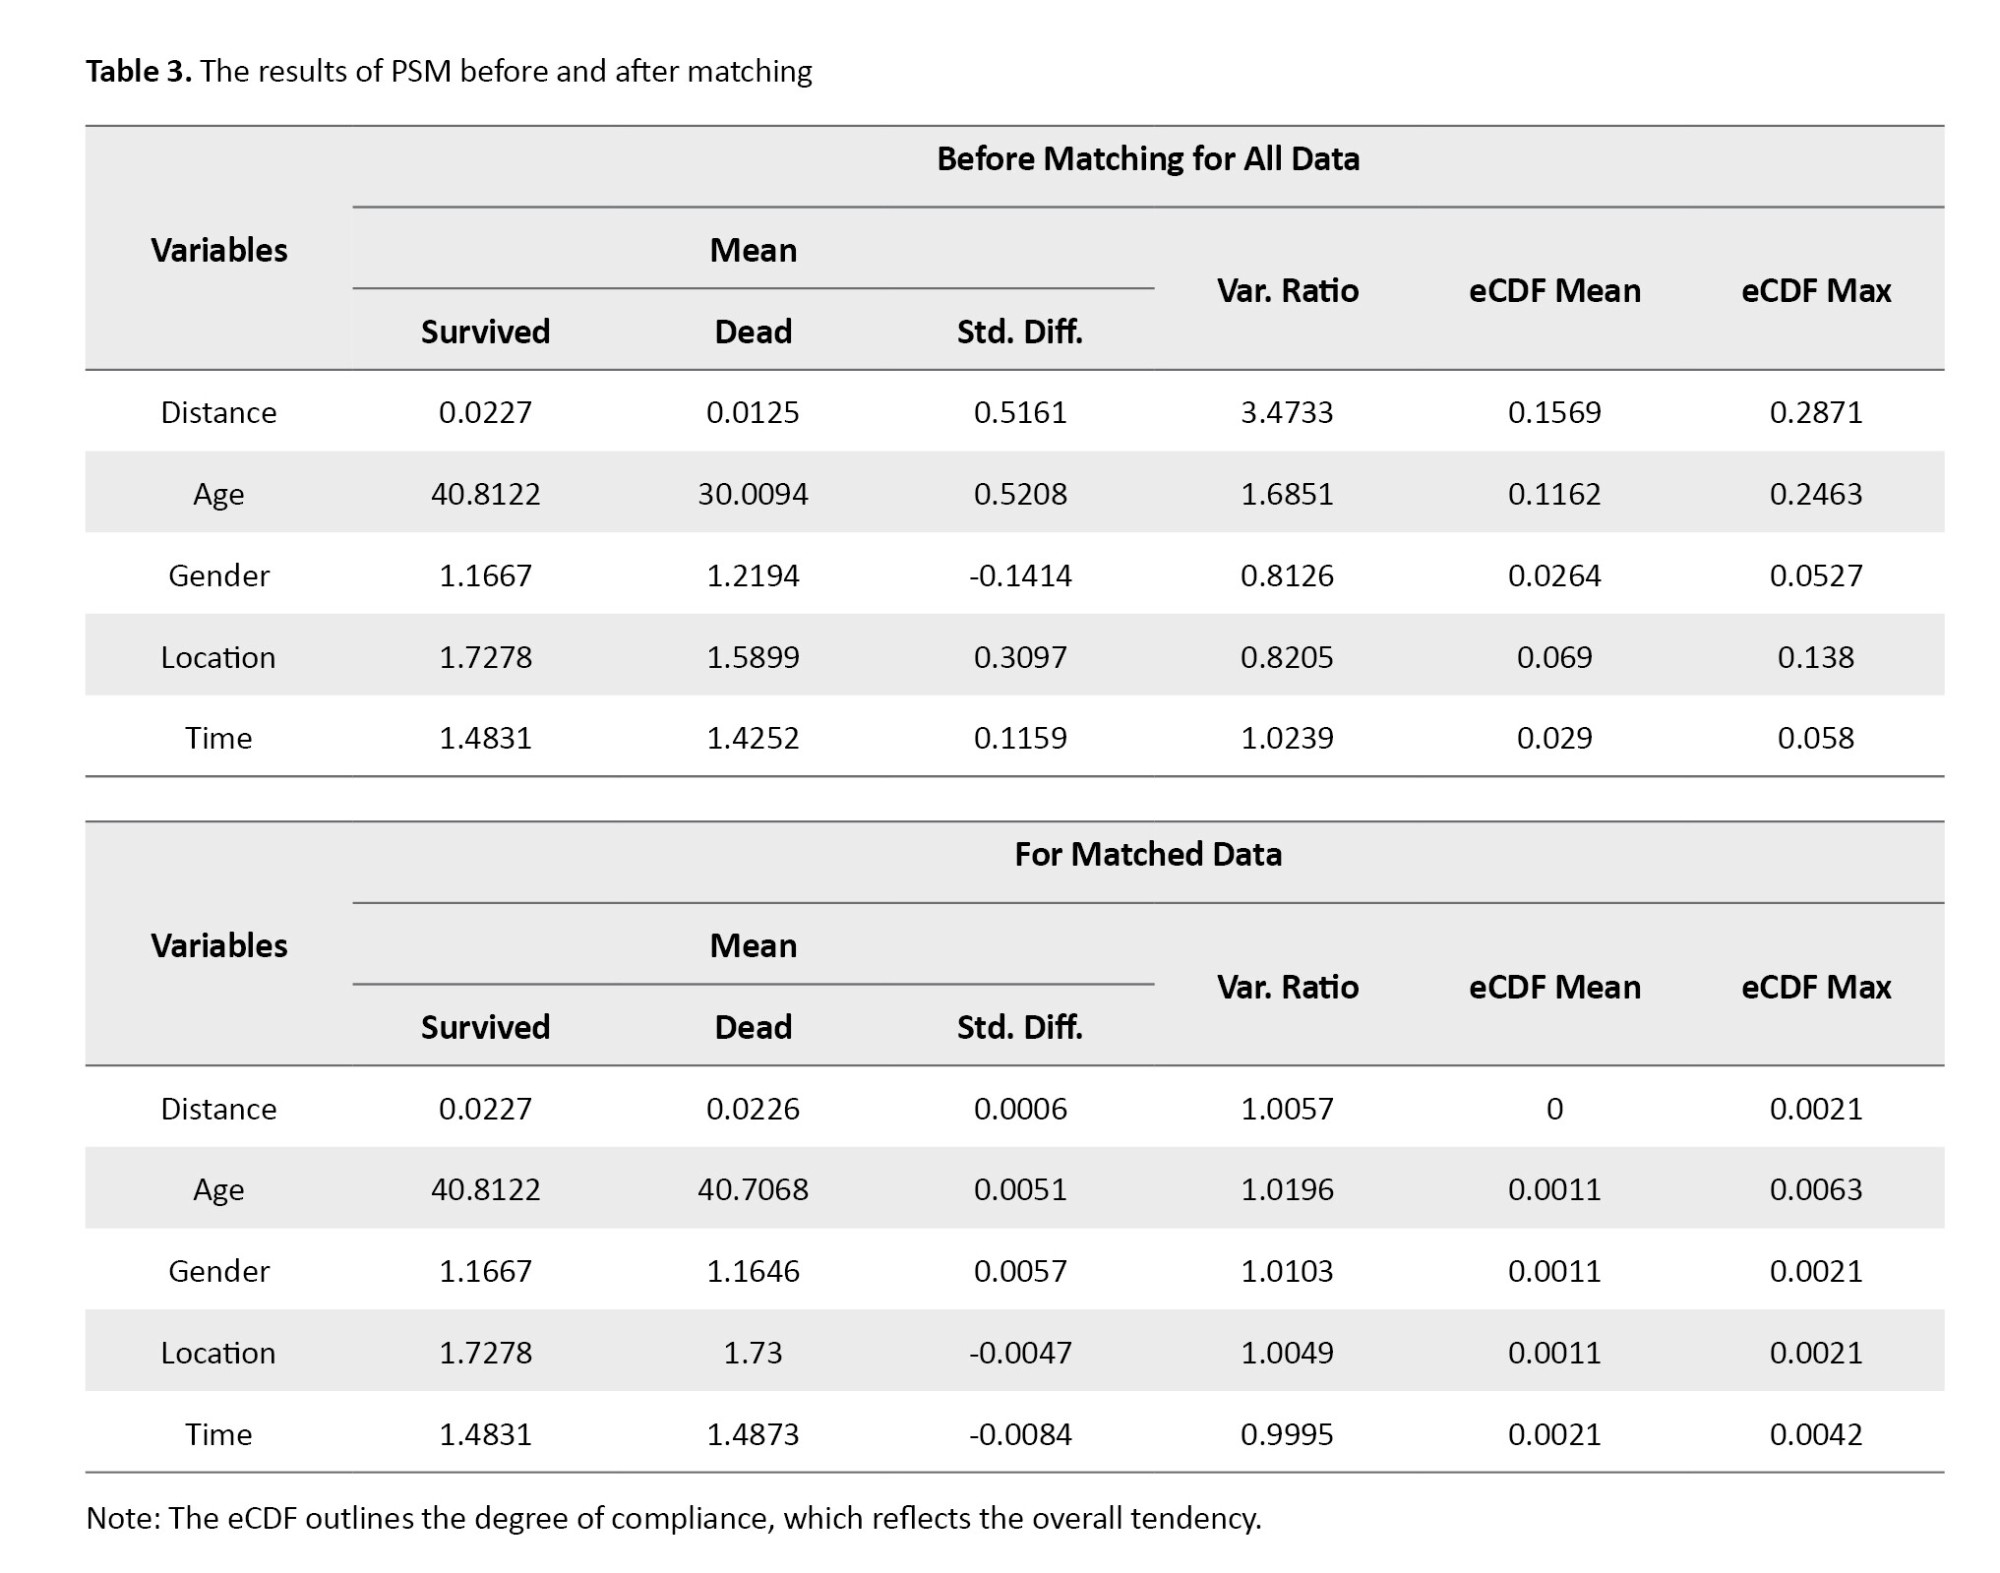
Table 4 shows the MLR coefficients and adjusted ORs after PSM. This analysis entails modeling the probability that an individual involved in accidents may belong to one group as opposed to another, based on the confounding factors. The results revealed that SPO2 and age were the only significant factors, with SPO2 being the most significant predictor of RTA mortality.
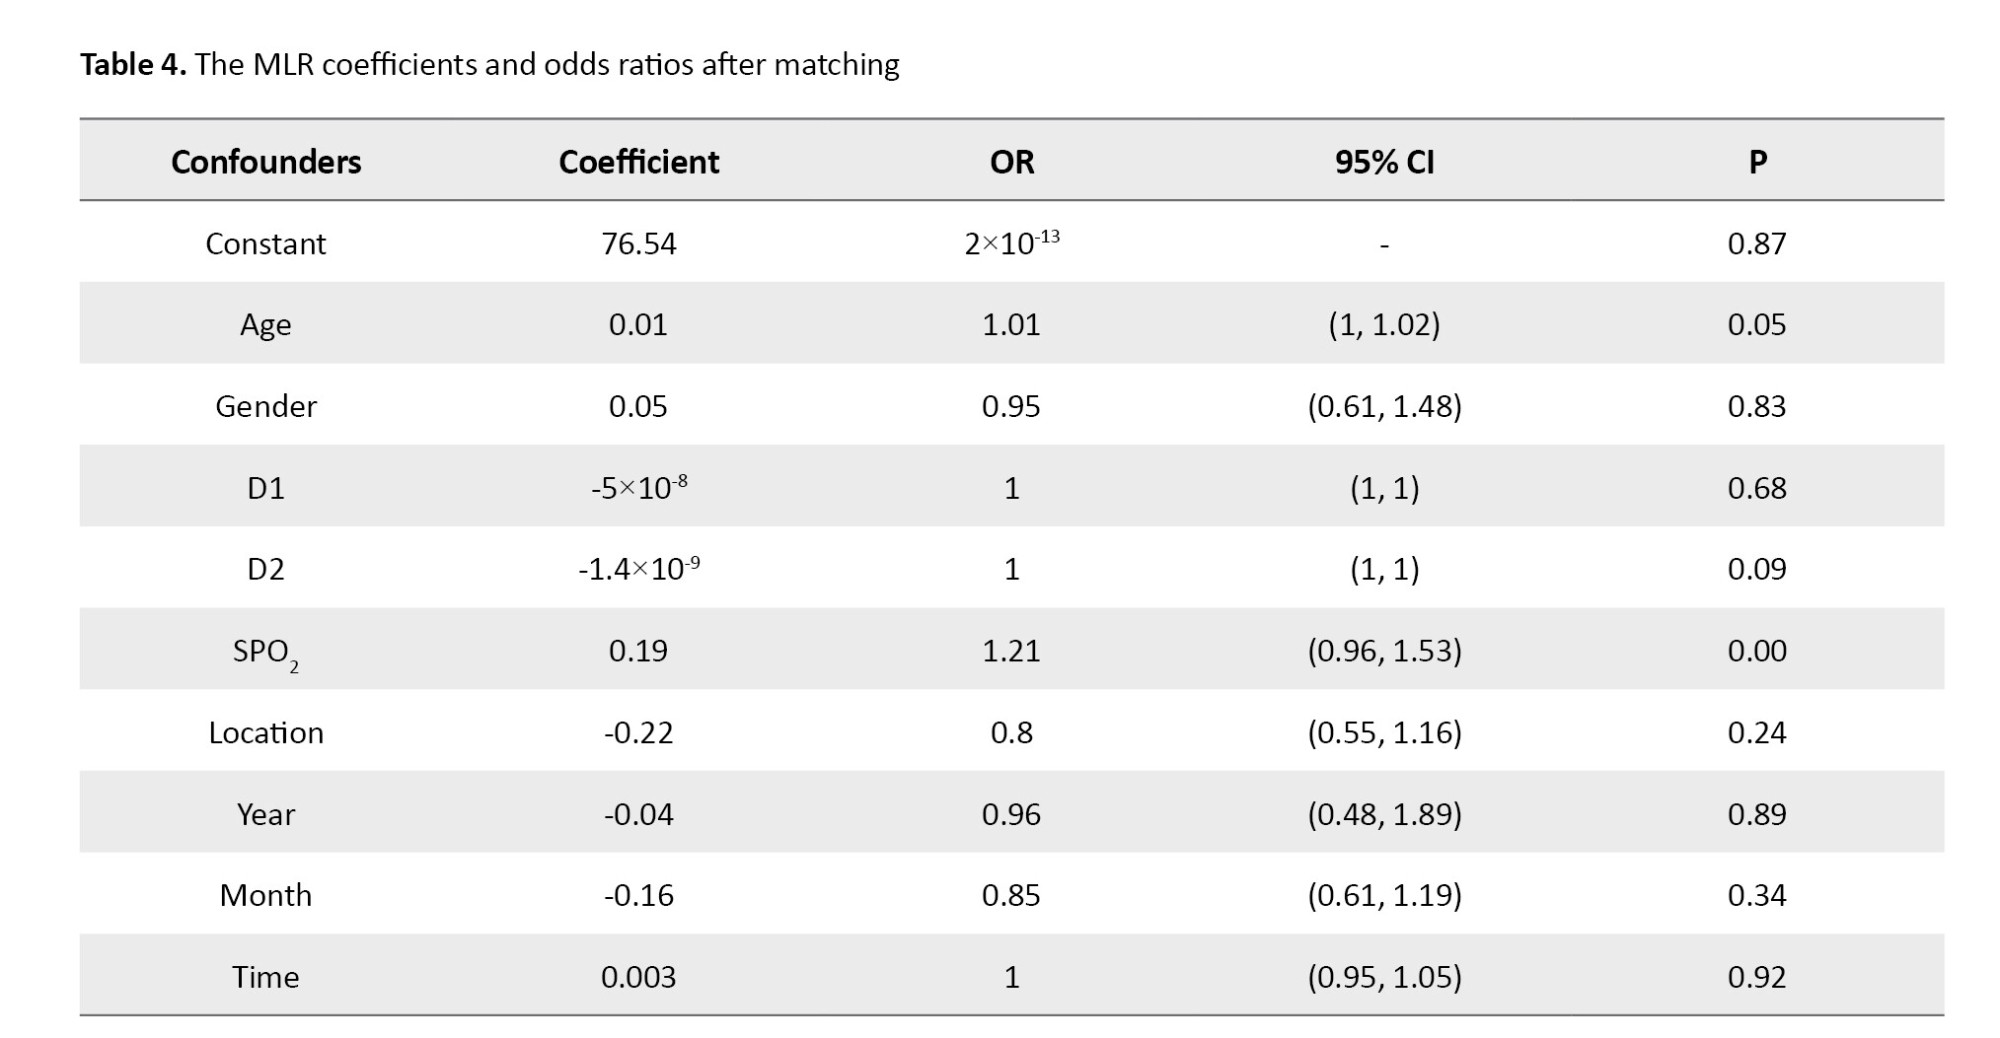
Table 5 shows the RMSE and MAPE values of the forecasting models MLR, ARIMA, and PSM for urban and suburban areas. The ARIMA and PSM models demonstrate higher predictive accuracy compared to the MLR model, since they had lower RMSE and MAPE values. The selection of confounding factors has a direct impact on these metrics, as omitting essential predictors results in underfitting, which subsequently increases RMSE and MAPE due to systematic bias. On the other hand, the inclusion of irrelevant confounders may lead to overfitting, which can reduce in-sample results but deteriorate out-sample results. Covariate balance assessments indicate whether the matching process has enhanced the predictive fairness of the PS. This, in turn, provides indirect insights into RMSE and MAPE if balance is successfully achieved.
The lowest RMSE recorded in both urban (5.12) and suburban (6.79) areas for the PSM indicates that the PSM exhibits the smallest prediction errors. On average, its mortality rate predictions deviate by 5–7 units from the actual values, which is considerably more accurate than the MLR/ARIMA models. The ARIMA model had an RMSE of 15.26 for urban areas and 14.75 for suburban areas, suggesting a moderate level of accuracy. In contrast, the MLR model had a higher RMSE of 32.76 in urban settings and 25.13 in suburban settings, indicating the worst performance among the models evaluated. These results suggest that PSM more effectively captures the predictors of RTA mortality rates, while the high errors of the MLR indicate an inadequate fit. Additionally, the data presented in Table 5 indicated that all models exhibited higher RMSEs in urban areas, implying that RTA mortality rate is more difficult to predict in urban areas, potentially due to the complexities of traffic dynamics.
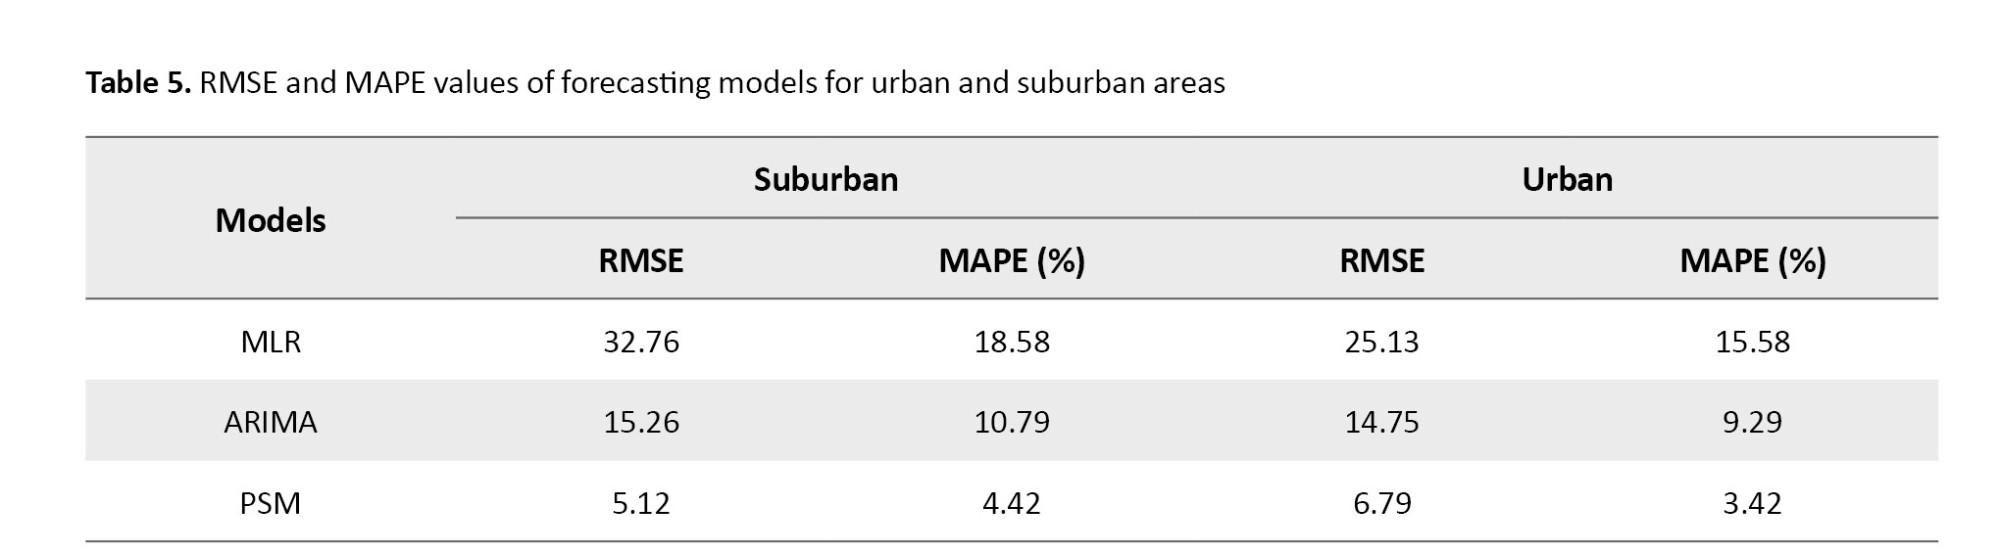
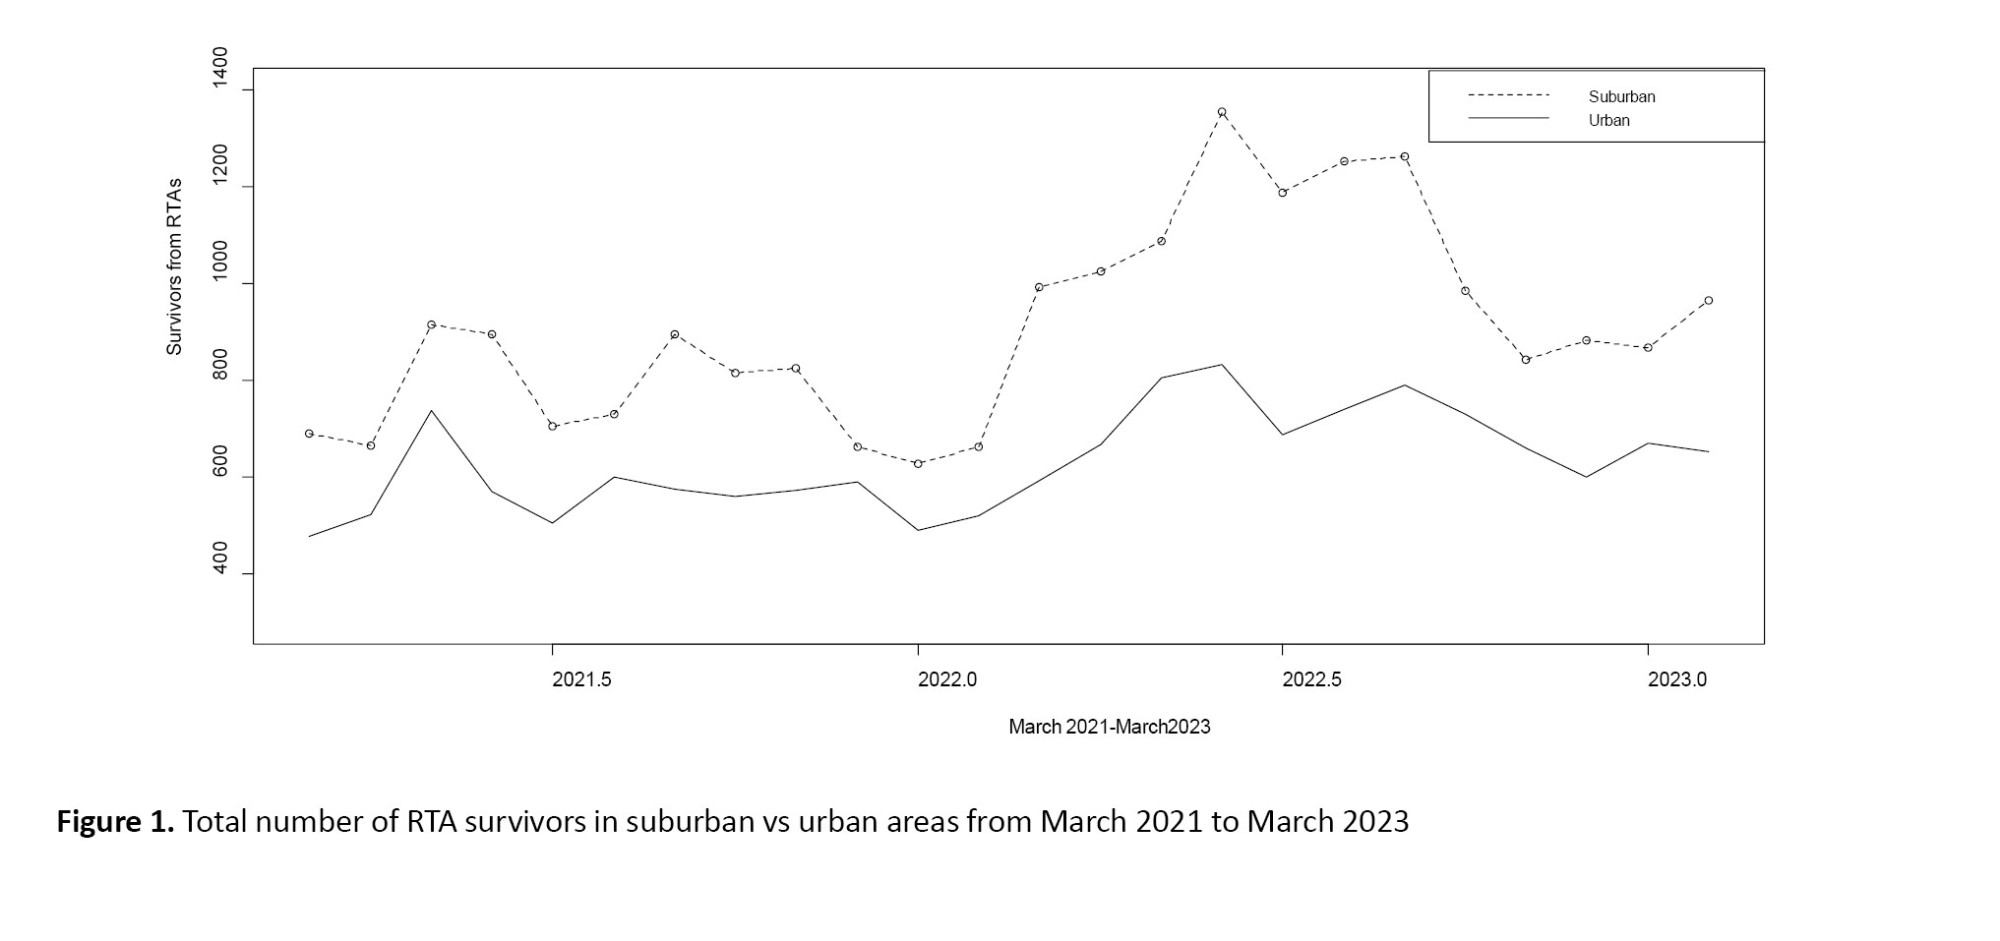
Figure 1 illustrates the total number of RTA survivors in suburban and rural areas from March 2021 to March 2023. As can be seen, the number of survivors was lower in urban areas compared to suburban areas, due to a lower incidence rate.
Due to the inherent characteristics of suburban driving conditions, which can include higher driving speeds, less traffic control, and greater distances from emergency services, suburban areas are at higher risk of RTAs. Factors associated with crashes can also be effective, including road conditions, visibility, and the availability of immediate medical assistance following an accident. Overall, while both suburban and urban areas experience RTAs, the degree and context of these accidents differ, leading to variations in survival rate. Figure 2 plots the total number of RTA mortalities in suburban and rural areas from March 2021 to March 2023. Over the two-year period, suburban areas experienced a higher number of mortalities from RTAs compared to urban areas.
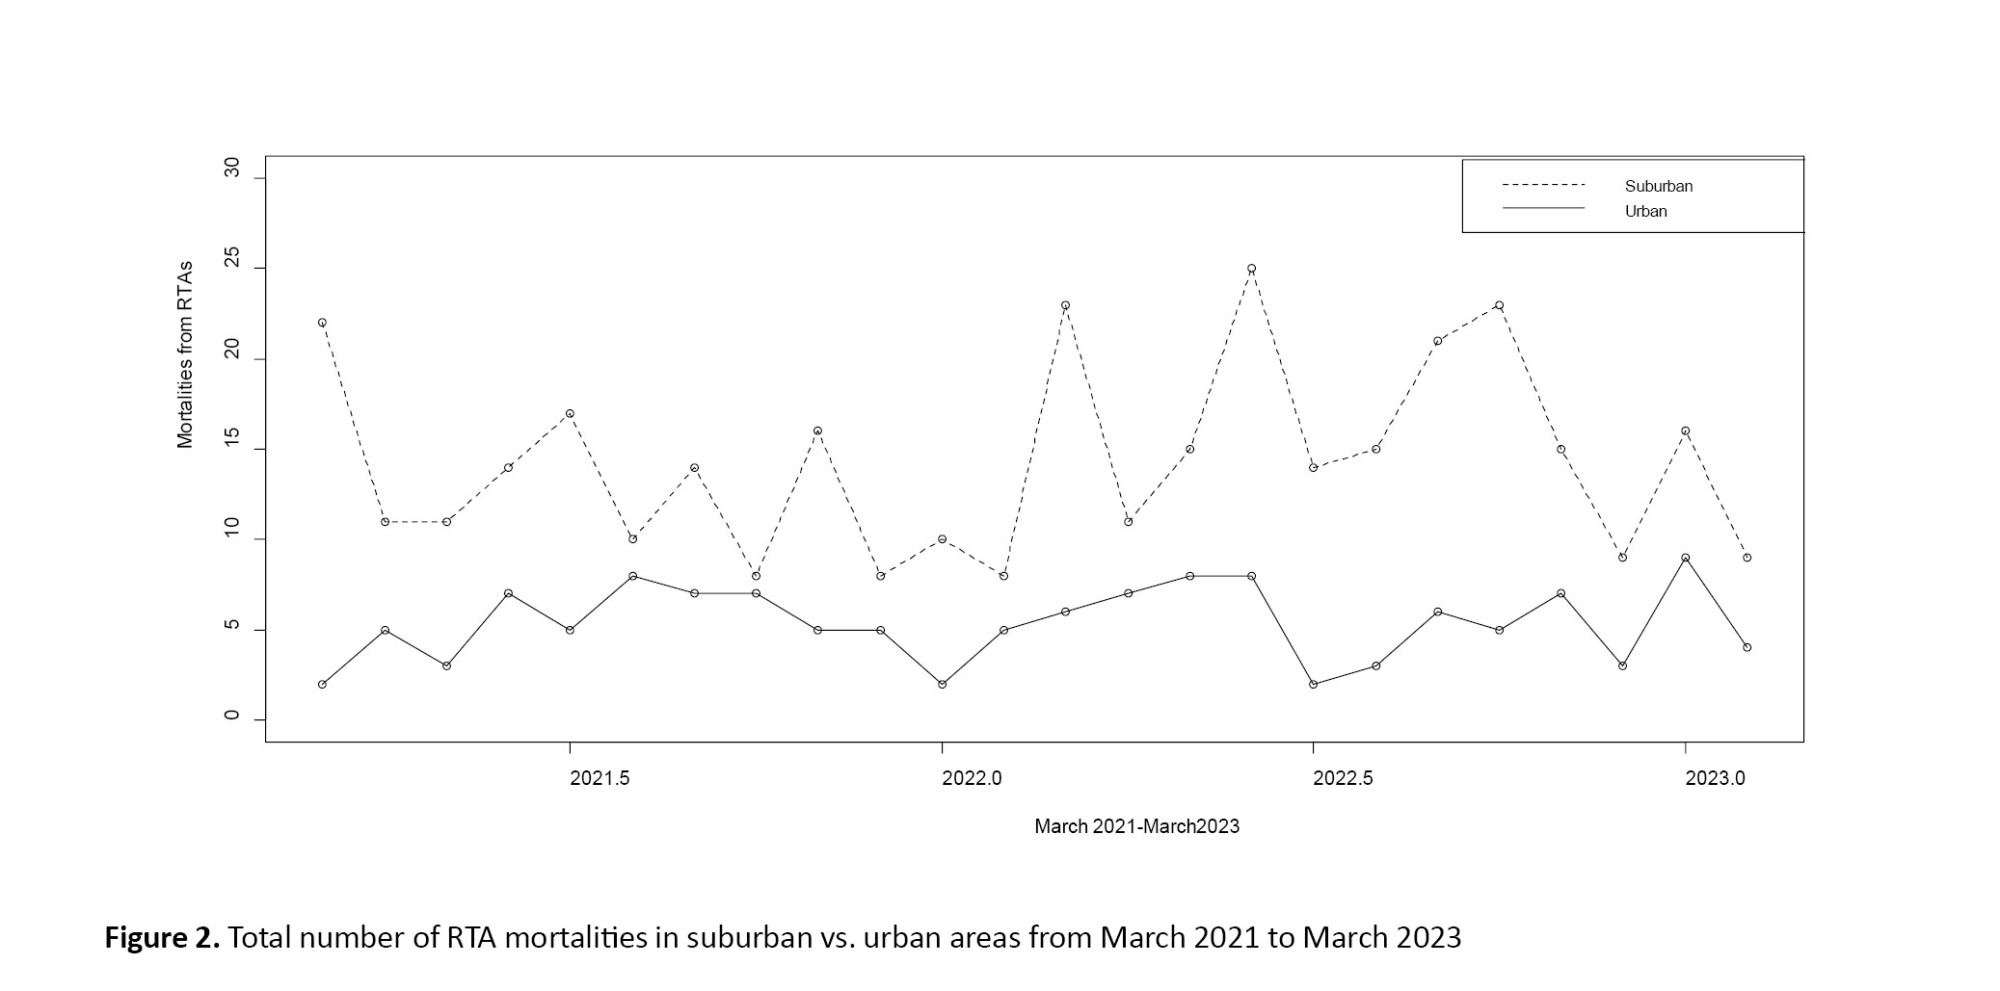
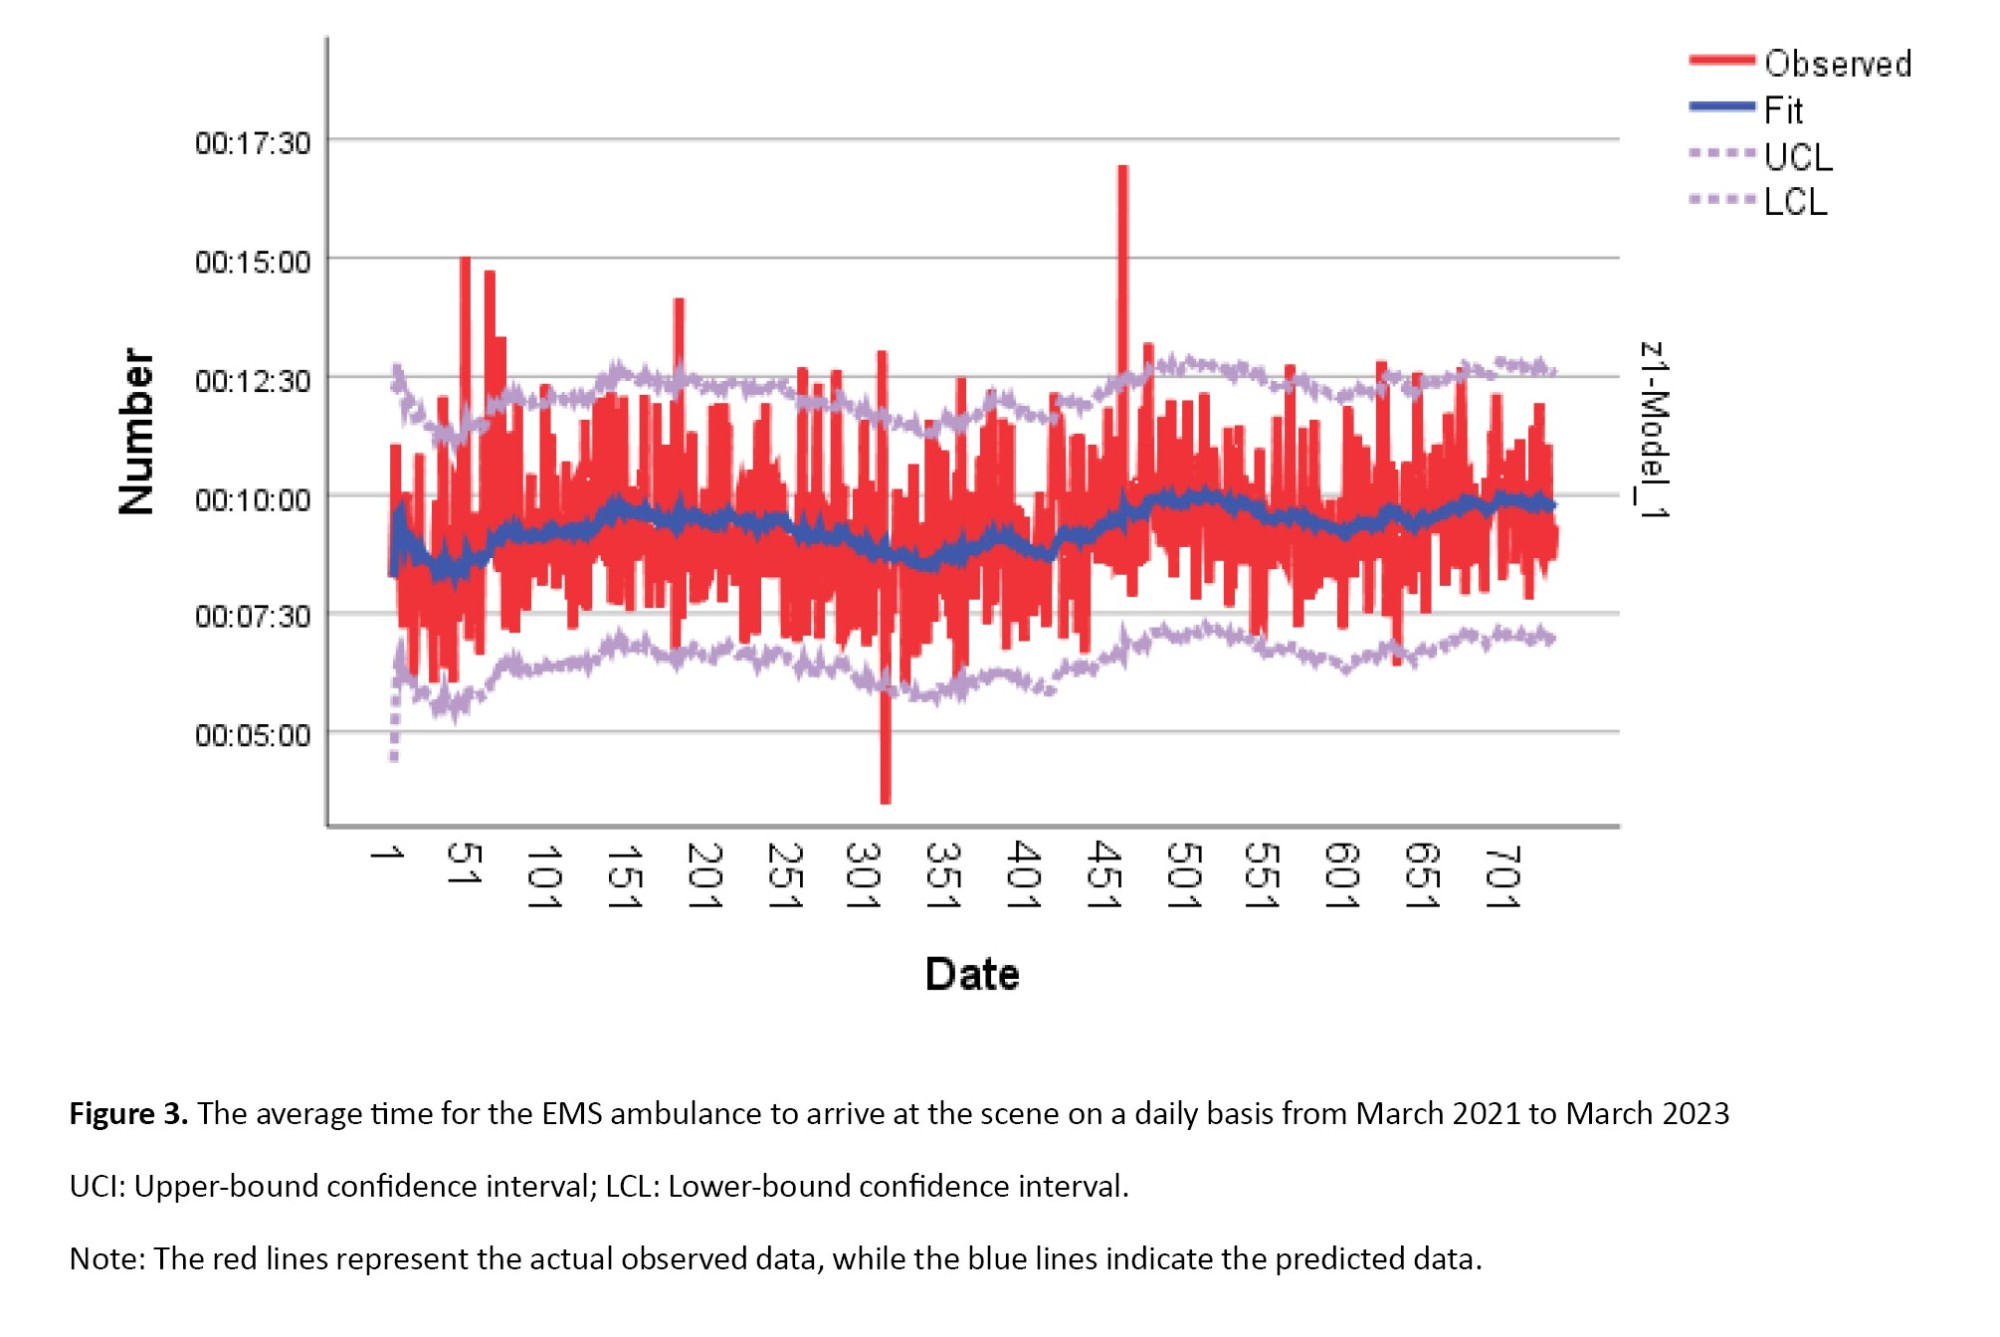
Figure 3 illustrates the daily average time for the EMS ambulance to arrive at the scene from March 2021 to March 2023 (700 days). The higher times observed in Figure 3 show critical cases when the EMS ambulance arrives late at the scene. By exploring the various factors that contribute to these delays and conducting a thorough analysis, authorities should implement effective measures to improve emergency response time and ensure better outcomes for RTAs.
Discussion
This study aimed to compare mortality rates of RTAs between urban and suburban areas in Golestan Province, north of Iran, using time-series data and forecasting models MLR, ARIMA, and PSM, which have not been previously addressed. Our findings revealed that the mortality rate was significantly higher in suburban areas (1.6%) compared to urban areas (0.8%), indicating a twofold increased risk of death in suburban areas. Key factors contributing to this result may be longer emergency response times, reduced access to healthcare facilities, and differences in road infrastructure and traffic conditions in suburban areas. Previous studies have indicated that delayed medical intervention worsens trauma outcomes [4, 5]. Studies in other parts of Iran have also reported increased RTA mortality in rural or suburban areas due to longer travel times to hospitals [8, 9]. The EMS ambulances take longer time to arrive at the accident scene in suburban areas, increasing the risk of death for critically injured individuals, particularly those with low SPO2.
The urban areas exhibited lower RTA mortality rates, maybe due to higher traffic density leading to slower speeds and less severe collisions, as well as better access to trauma care. This result is consistent with results of studies demonstrated that urban RTAs often involve low-speed impacts, resulting in non-fatal injuries [5, 21] (e.g. whiplash or minor fractures) rather than life-threatening trauma. This aligns with the speed-fatality gradient well-documented in road safety literature, where higher speeds exponentially increase the risk of fatal outcomes. Additionally, stricter traffic laws in cities (e.g. speed limits, pedestrian crossings, and traffic calming measures), may contribute to lower accident severity. Differences in road infrastructure and vehicle types may also have a role. Conversely, suburban roads often have higher speed limits and fewer safety measures, increasing the likelihood of severe crashes. Previous research has highlighted that high-speed collisions in less regulated areas significantly elevate fatality risks [7, 12]. Our use of PSM helped control for confounding variables, strengthened the validity of these comparisons [31], confirming that suburban accidents involve higher-risk conditions (e.g. uncontrolled intersections, poor lighting, and delayed EMS ambulance access). A study reported that the incidence of RTAs during the summer months was nearly twice that in other seasons. Their results revealed a greater number of male victims with lower average age compared to females. Additionally, the study indicated a mortality rate of approximately 1.4% in Golestan Province [7]. Consistent with these results, we found an RTA mortality rate of 1.3%. Furthermore, our findings showed that the average age of male patients was less than that of female patients, and the number of male patients was higher. Notably, in our two study areas, a gender difference was evident; in suburban regions, the number of male victims (59.2%) was more than that of female victims (58.9%), while in urban areas, females (41.1%) were more than males (40.8%).
Deretić et al. [22] utilized the seasonal ARIMA model (SARIMA) for forecasting of traffic accidents and showed a notable seasonal trend using the time-series data. The model had an MAPE of 5.22%, which implies that the forecasts generated by the model were sufficiently accurate. The authors explained that an MAPE<10% is indicative of highly accurate predictions, 10-20% suggests good forecasting, 20-50% represents reasonable forecasting, and >50% shows inaccurate forecasting. In our study, the findings demonstrated that the prediction of RTA mortality rates by the PSM model was highly accurate in both urban and suburban areas, based on the MAPE value.
Mohammadi [19] revealed that 66% of the injuries involved car occupants, including both drivers and passengers, with a male-to-female ratio of 5:1. The most pronounced male-to-female ratio was observed among drivers (12.2:1), whereas pedestrians exhibited the lowest ratio (1.8:1). The majority of injuries occurred 16:00 and 20:00, followed by the period from 08:00 AM to 12:00 PM. The highest incidence of injuries was recorded among males aged 18-24 years. In our study, in suburban areas, a higher number of RTAs occurred at daytime more than at night, while urban areas experienced a higher number of accidents at night. This trend can be due to several key factors. Suburban roads often serve as connectors for commuters, commercial transport, and school-related travel, leading to higher traffic volumes during daylight hours. Also, there are usually fewer late-night or shift workers and entertainment centers in suburban areas, reducing nighttime traffic. In urban areas, there are vibrant nightlife, extended business hours, and shift work (e.g. healthcare work), increasing nighttime traffic density.
Conclusion
Our findings showed the RTA forecasting performance of ARIMA and PSM models, with PSM proving higher accuracy for both urban and suburban areas. The results highlight the promise of data-driven modeling. The RTA mortality rate is higher in suburban areas of Golestan Province than in its urban areas. This difference indicates the need for deeper exploration of region-specific factors, including emergency service coverage, road infrastructure, and socioeconomic elements, which may not be captured by the forecasting models. Future research should benefit from incorporating spatial analytics or hybrid modeling approaches to better understand these disparities.
Study limitations
This study had some limitations and disadvantages. First, varying service quality across health centers may have led to inconsistent medical reporting. To mitigate this, future studies should employ standardized trauma registries or accredited emergency departments, with sensitivity analyses to assess and exclude lower-quality health centers. Second, integrating diverse data sources (e.g. traffic patterns, accident reports) was challenging due to inconsistent formats and referencing systems. Adopting interoperable data standards, automated cleaning tools, and their testing in pilot studies can improve integration. Third, the underreporting of minor traffic injuries (often due to the absence of medical treatment) may have led to selection bias. Supplementing hospital data with community surveys or law enforcement records, along with statistical methods such as capture-recapture analysis, can address this issue. A prospective study with standardized protocols can further enhance data consistency.
Ethical Considerations
Compliance with ethical guidelines
This study was approved by the Ethics Committee of Golestan University of Medical Sciences, Gorgan, Iran (Code: IR.GOUMS.REC.1402.127). The study followed rigorous ethical standards in examining RTA data through time-series forecasting models. To safeguard victim privacy, all datasets were anonymized, and sensitive personal details were excluded.
Funding
This research did not receive any grant from funding agencies in the public, commercial, or non-profit sectors.
Authors contributions
Conceptualization, study design and initial draft preparation: Manoochehr Babanezhad; Data collection, data aalysis and interpretation: Hassan Khorsha and Ali Mohajervatan; Review, editing and final approval: All authors.
Conflict of interest
The authors declared no conflict of interest.
Acknowledgements
The authors would like to thank Golestan University and the Golestan University of Medical Sciences.
References
Road traffic accidents (RTAs) are a major global health challenge, accounting for approximately 1.19-1.3 million deaths each year. Alarmingly, 93% of these deaths occur in low- and middle-income countries, even though these countries own only 60% of the world’s vehicles [1-6]. Iran is among the countries with a high mortality rate from RTAs, with nearly 16,000 lives lost annually. The accidents are especially prevalent in high-traffic areas of the country, like the roads of northern provinces, where poor road conditions, frequent traffic violations, and insufficient law enforcement exacerbate the incidence of RTAs [6-8]. The consequences of these accidents, in addition to death, include physical disabilities, emotional trauma, and financial burdens on families and the healthcare system [7-12]. Contributing factors include human error (e.g. exceeding speed), vehicle defects, inadequate infrastructure, and environmental hazards [13-17].
While prior studies have examined risk factors and policies for RTAs, critical gaps still remain, including a lack of comparative urban-suburban analyses [5-15] and insufficient attention to temporal trends [18-22]. A comparative analysis of RTAs and related mortality rates between urban and suburban areas provides essential insights into disparities in risk factors, infrastructural challenges, and policy requirements. However, most studies rely on cross-sectional data, missing seasonal variations and long-term patterns that can enhance efforts to prevent accidents [7-10, 21-25]. Time-series data, though underutilized, offers valuable predictive insights into accident dynamics [21-29]. For instance, urban areas may experience peak RTAs during rush hours due to congestion, whereas suburban fatalities might surge on weekends or holidays as a result of high-speed driving. Forecasting models can predict these fluctuations, enabling tailored traffic control measures for each setting. Similarly, suburban roads, which are often less maintained than urban roads, may see a higher RTA-related mortality rate during adverse weather conditions such as rainy or snowy days. Additionally, urban and suburban expansion may alter accident rates over time. Forecasting models can help planners to anticipate future risks and optimize infrastructure development before the occurrence of accidents. However, few studies have used advanced forecasting methods such as multiple logistic regression (MLR), the autoregressive integrated moving average (ARIMA), and propensity score matching (PSM) models [29-31] to analyze urban and suburban RTA trends closely.
This study addresses these gaps by analyzing temporal trends of RTAs in Golestan Province, north of Iran, providing evidence for better traffic management and emergency response. This study aims to explore various aspects of RTA mortality rates resulting in urban and suburban areas of the province using MLR, ARIMA, and PSM forecasting models. The MLR model is useful for studying how confounding factors relate to a binary response variable, such as mortality across urban and suburban areas. The ARIMA model provides insights into temporal trends and patterns of mortality across urban and suburban regions. We also employed the semi-parametric PSM method to identify comparable features between urban and suburban areas. This involves distinguishing groups based on their propensity score (PS), which are defined as random effects within a mixed-effects model. The novelty of this study is the integration of PSM with a time-series data framework, offering a fresh perspective on forecasting RTA mortality rates across urban and suburban areas. The key questions are: What are the differences in RTA mortality rates between urban and suburban areas? How can the proposed forecasting models help in decision-making for staffing in emergency response centers in urban and suburban areas? Which model is more effective for forecasting RTA mortality rates in these areas?
Materials and Methods
Study design and data
This retrospective cohort study was carried out using the RTA data (n=37,409) reported by Emergency Medical Services (EMS 115) from March 2021 to March 2023 in Golestan Province, located in northeast Iran. The inclusion criteria were cases such as RTAs injuries that need medical care, fatalities at the scene, dangerous situations, and mass casualty events. On the other hand, the exclusion criteria were the cases that are usually not recorded by the EMS 115, such as minor accidents without injuries, medical emergencies not related to traffic, non-urgent transportation, and incidents not occurring on the road.
This study measured multiple factors related to RTA scenarios, including age and gender of the individual involved in the accident, the duration between the ambulance being dispatch and its arrival at the scene (D1), the duration between receiving the message and the ambulance’s arrival at the treatment center (D2), peripheral oxygen saturation level (SPO2) at the time of accident, location of accident (urban or suburban area), year of accident (from March 2021 to March 2023), month of accident, and time of accident (daytime or nighttime). Descriptive statistical methods were utilized to summarize the data, including calculations of Mean±SD.
Forecasting methods
We used forecasting models MLR, ARIMA, and PSM within a time-series data framework. Although MLR and PSM are not conventionally standard models for time-series forecasting, they can be effectively applied to analyze the time-series data. The ARIMA model excels in forecasting continuous time series, while the MLR model is suited for classification tasks. The choice depends on whether the focus is prediction of values (ARIMA) or probabilities (MLR) and how well temporal dependencies are handled. For rigorous time-series classification, extending MLR with autoregressive terms or PSM model may be necessary, because, the MLR method may involve the inclusion of lagged variables to tackle autocorrelation by accounting for the temporal structure [29-31]. Regarding the PSM model, it is essential to consider time-related confounding factors such as age, SPO2, and gender; and also, potentially match within time strata or employ time-dependent covariates [31]. We apply these three different models to our dataset and assess their performance using the root mean square error (RMSE) and the mean absolute percentage error (MAPE) criteria [22]. These two errors criteria are calculated as Equations 1 and 2:
where Yt and are the observed and predicted values, respectively, for all time t, n is the total number of observations and k is the samples size (k
ARIMA is a popular time-series model designed for forecasting using historical data. It extends the ARMA model by including differencing, making it suitable for non-stationary data. If no differencing is needed (d=0), ARIMA reduces to ARMA. While ARMA works specifically with stationary time series, ARIMA is tailored for handling non-stationary ones. This model helps to identify and forecast trends over time, providing a temporal context that is crucial for understanding how urban/suburban area development and increased vehicle numbers affect RTA rates. By applying the ARIMA model, researchers analyze temporal patterns, which are crucial for understanding the influence of the two above-mentioned factors on RTA rates over time. Conducting residual diagnostics is crucial for evaluating the validity of the ARIMA model, ensuring that the residuals exhibit independence. For this purpose, the Ljung-box portmanteau test was utilized to assess the adequacy of the fitted ARIMA model. This statistical test is based on the autocorrelation of the squared residuals. The Ljung-box portmanteau test statistic is calculated as Equation 3:
where n is the total number of observations, h is the number of lags to include in the test, and rk indicates the sample autocorrelation coefficients at lag k. The test statistic Q follows a chi-square distribution with h-w degrees of freedom where h is the number of lags the test is computed for and w is the number of parameters used in fitting the model. Our data consists of information spanning two years. This data is regarded as a sample, and the calculated rk at different lags (k=1, 2, …, h) represents the sample autocorrelation of the residuals. The range of their variation is (-1, 1). To perform the Ljung-box test, we first determine the sample autocorrelations rk for the specified lags up to h. We assess the P; if the P>0.05, it confirms the null hypothesis, indicating that the residuals do not have significant autocorrelation and that the ARIMA model is appropriate. In contrast, if the P<0.05, we reject the null hypothesis, suggesting that significant autocorrelation exists in the residuals, and the ARIMA model is inappropriate.
The Ljung-box portmanteau test results of our study revealed that the residuals from our fitted ARIMA model do not exhibit significant autocorrelation, supporting the model’s adequacy for the time-series data. They follow an ARIMA (p, d, q) model, where p represents the Autoregressive order, d denotes the number of differencing steps applied to the data to achieve stationarity, and q signifies the Moving Average order. Our dataset was non-stationary. By applying a single time difference (d=1), we transformed it into stationary data. Subsequently, we generated plots for the autocorrelation function and the partial autocorrelation function to determine the suitable orders p and q. Consequently, we concluded that our data was well-suited for the ARIMA (1, 1, 1) model. Finaly, differentiating the autoregressive moving average model (ARIMA) (1, 1, 1) using the Ljung-box test, it was significant (P>0.05). The key advantage of the Ljung-box test is that it helps assess whether the model has adequately captured the structure of the data or whether significant patterns remain unexplained.
MLR model
The MLR model analyzes the impact of multiple independent variables on a binary outcome (e.g. accident outcome such as survival/death), allowing researchers to control for confounding factors. This approach can be adjusted for time-series analysis, particularly when the outcome is binary and time-dependent, and the predictors involve lagged variables [29]. The model is described as Equation 4:
Where Yt is the actual observed response variable (death or survival), Xt is the set of explanatory variables, and Ԑt is the error term at time t.
PSM method
PSM is a semi-parametric approach that matches groups with similar attributes, enabling a more accurate prediction of RTAs. This method distinguishes between urban and suburban areas based on their PS, which are treated as random effects in a mixed-effects model. By identifying and matching similar characteristics among different groups, this method aims to reduce selection bias and enhance the validity of comparisons. This estimation technique allows for the examination of data over time (longitudinal data setting), which is important for capturing changes in RTA rates relative to urban growth and policy changes. This innovative combination allows for a more nuanced understanding of the factors influencing RTAs, facilitating comparisons across different urban and suburban contexts. In such instances, it is essential to ensure that the distribution of covariates such as SPO2 is balanced at each time point.
We used the PS derived from the Cox proportional hazards model, which is employed in risk set matching. We employed the PS to predict RTA mortality rates. The outcome was binary; 1 (death) or 0 (survival), determined by factors including D1, D2, age, gender, SPO2, location (urban, suburban), year, month, and time factors. Logistic regression was employed, and the nearest neighbor matching technique was applied in this context [31]. Then, individuals were matched to assess mortality risks among comparable risk profiles (e.g. high-SPO2 vs low-SPO2 groups). In the regression model, the variable was considered 0 or 1 (survival or death), while other factors were confounding factors. Our analysis demonstrated that matching based on the PS successfully achieved a balanced distribution of covariates between individuals who died and those who survived after RTAs.
Data analysis
The statistical analysis was carried out in R software, version 4.5.0. To evaluate differences in demographic characteristics and RTA injuries between urban and suburban areas, independent t-test was employed, while the chi-square test was used to examine difference in categorical variables. P<0.05 was considered statistically significant.
Results
This study analyzed 37,409 records of RTAs collected from March 2021 to March 2023. As shown in Table 1, the survival rate was 98.7% (n=36931) and only 1.3% (n=478) led to death. The mortality rate of RTAs occurred in suburban areas was twice the rate in urban areas (1.6% vs 0.8%). The accidents happened more at daytime, while the mortality rate was higher for RTAs occurred at nighttime (P=0.008). Also, most of accidents occurred in suburban areas than in urban areas. The age of deceased individuals was significantly higher than that of survivors, while their mean SPO2 level was lower than that of survivors. Moreover, there was a statistically significant difference between men and women (P=0.038), where men experienced more RTAs compared to women.
The results of MLR before PSM presented in Table 2 indicated the statistically significant association of RTA mortality rate with age, gender, D2, SPO2 level, location, month, and the time of the accident (daytime vs. nighttime) (P<0.05). Additionally, the analysis reveals that a decrease in SPO2 is associated with a 35% increase in the risk of RTA mortality. Furthermore, males have 37% lower odds of RTA mortality rate compared to females (OR=0.63, 95% CI, 0.46%, 0.87%). Location of accident predicted a change by 2.08 units in RTA mortality rate (OR=2.08, 95% CI, 1.57%, 2.77%). The year of accident predicted the risk of RTA mortality rate by 46%. The time of accidents predicted the risk of RTA mortality rate by 1.34 units.
The standard error (SE) in the estimated effect size (log-odds coefficients) for all covariates can be derived from the ORs at 95% CI as Equation 5:
We used the PSM method to analyze RTA data while adjusting for four non-modifiable confounders, which were selected since the emergency center was unable to modify them and also due to their significant baseline differences (P<0.05). Table 3 shows the PSM results for the distance (convergence metric) and confounders between the death and survival groups before and after successful matching. The mean values for distance and confounders showed improved balance and a substantial reduction in the standardized mean difference (from 0.52 for the total dataset to 6×10⁻⁴ in the matched dataset), confirming the algorithm’s effectiveness in matching of the characteristics of the two groups. This approach in fact allows for a more equitable comparison by pairing patients with similar characteristics, thereby minimizing biases that could affect the mortality [30, 31]. It should be noted that, the nearest neighbor matching technique was utilized to create a balanced comparison between two groups.
Table 4 shows the MLR coefficients and adjusted ORs after PSM. This analysis entails modeling the probability that an individual involved in accidents may belong to one group as opposed to another, based on the confounding factors. The results revealed that SPO2 and age were the only significant factors, with SPO2 being the most significant predictor of RTA mortality.
Table 5 shows the RMSE and MAPE values of the forecasting models MLR, ARIMA, and PSM for urban and suburban areas. The ARIMA and PSM models demonstrate higher predictive accuracy compared to the MLR model, since they had lower RMSE and MAPE values. The selection of confounding factors has a direct impact on these metrics, as omitting essential predictors results in underfitting, which subsequently increases RMSE and MAPE due to systematic bias. On the other hand, the inclusion of irrelevant confounders may lead to overfitting, which can reduce in-sample results but deteriorate out-sample results. Covariate balance assessments indicate whether the matching process has enhanced the predictive fairness of the PS. This, in turn, provides indirect insights into RMSE and MAPE if balance is successfully achieved.
The lowest RMSE recorded in both urban (5.12) and suburban (6.79) areas for the PSM indicates that the PSM exhibits the smallest prediction errors. On average, its mortality rate predictions deviate by 5–7 units from the actual values, which is considerably more accurate than the MLR/ARIMA models. The ARIMA model had an RMSE of 15.26 for urban areas and 14.75 for suburban areas, suggesting a moderate level of accuracy. In contrast, the MLR model had a higher RMSE of 32.76 in urban settings and 25.13 in suburban settings, indicating the worst performance among the models evaluated. These results suggest that PSM more effectively captures the predictors of RTA mortality rates, while the high errors of the MLR indicate an inadequate fit. Additionally, the data presented in Table 5 indicated that all models exhibited higher RMSEs in urban areas, implying that RTA mortality rate is more difficult to predict in urban areas, potentially due to the complexities of traffic dynamics.
Figure 1 illustrates the total number of RTA survivors in suburban and rural areas from March 2021 to March 2023. As can be seen, the number of survivors was lower in urban areas compared to suburban areas, due to a lower incidence rate.
Due to the inherent characteristics of suburban driving conditions, which can include higher driving speeds, less traffic control, and greater distances from emergency services, suburban areas are at higher risk of RTAs. Factors associated with crashes can also be effective, including road conditions, visibility, and the availability of immediate medical assistance following an accident. Overall, while both suburban and urban areas experience RTAs, the degree and context of these accidents differ, leading to variations in survival rate. Figure 2 plots the total number of RTA mortalities in suburban and rural areas from March 2021 to March 2023. Over the two-year period, suburban areas experienced a higher number of mortalities from RTAs compared to urban areas.
Figure 3 illustrates the daily average time for the EMS ambulance to arrive at the scene from March 2021 to March 2023 (700 days). The higher times observed in Figure 3 show critical cases when the EMS ambulance arrives late at the scene. By exploring the various factors that contribute to these delays and conducting a thorough analysis, authorities should implement effective measures to improve emergency response time and ensure better outcomes for RTAs.
Discussion
This study aimed to compare mortality rates of RTAs between urban and suburban areas in Golestan Province, north of Iran, using time-series data and forecasting models MLR, ARIMA, and PSM, which have not been previously addressed. Our findings revealed that the mortality rate was significantly higher in suburban areas (1.6%) compared to urban areas (0.8%), indicating a twofold increased risk of death in suburban areas. Key factors contributing to this result may be longer emergency response times, reduced access to healthcare facilities, and differences in road infrastructure and traffic conditions in suburban areas. Previous studies have indicated that delayed medical intervention worsens trauma outcomes [4, 5]. Studies in other parts of Iran have also reported increased RTA mortality in rural or suburban areas due to longer travel times to hospitals [8, 9]. The EMS ambulances take longer time to arrive at the accident scene in suburban areas, increasing the risk of death for critically injured individuals, particularly those with low SPO2.
The urban areas exhibited lower RTA mortality rates, maybe due to higher traffic density leading to slower speeds and less severe collisions, as well as better access to trauma care. This result is consistent with results of studies demonstrated that urban RTAs often involve low-speed impacts, resulting in non-fatal injuries [5, 21] (e.g. whiplash or minor fractures) rather than life-threatening trauma. This aligns with the speed-fatality gradient well-documented in road safety literature, where higher speeds exponentially increase the risk of fatal outcomes. Additionally, stricter traffic laws in cities (e.g. speed limits, pedestrian crossings, and traffic calming measures), may contribute to lower accident severity. Differences in road infrastructure and vehicle types may also have a role. Conversely, suburban roads often have higher speed limits and fewer safety measures, increasing the likelihood of severe crashes. Previous research has highlighted that high-speed collisions in less regulated areas significantly elevate fatality risks [7, 12]. Our use of PSM helped control for confounding variables, strengthened the validity of these comparisons [31], confirming that suburban accidents involve higher-risk conditions (e.g. uncontrolled intersections, poor lighting, and delayed EMS ambulance access). A study reported that the incidence of RTAs during the summer months was nearly twice that in other seasons. Their results revealed a greater number of male victims with lower average age compared to females. Additionally, the study indicated a mortality rate of approximately 1.4% in Golestan Province [7]. Consistent with these results, we found an RTA mortality rate of 1.3%. Furthermore, our findings showed that the average age of male patients was less than that of female patients, and the number of male patients was higher. Notably, in our two study areas, a gender difference was evident; in suburban regions, the number of male victims (59.2%) was more than that of female victims (58.9%), while in urban areas, females (41.1%) were more than males (40.8%).
Deretić et al. [22] utilized the seasonal ARIMA model (SARIMA) for forecasting of traffic accidents and showed a notable seasonal trend using the time-series data. The model had an MAPE of 5.22%, which implies that the forecasts generated by the model were sufficiently accurate. The authors explained that an MAPE<10% is indicative of highly accurate predictions, 10-20% suggests good forecasting, 20-50% represents reasonable forecasting, and >50% shows inaccurate forecasting. In our study, the findings demonstrated that the prediction of RTA mortality rates by the PSM model was highly accurate in both urban and suburban areas, based on the MAPE value.
Mohammadi [19] revealed that 66% of the injuries involved car occupants, including both drivers and passengers, with a male-to-female ratio of 5:1. The most pronounced male-to-female ratio was observed among drivers (12.2:1), whereas pedestrians exhibited the lowest ratio (1.8:1). The majority of injuries occurred 16:00 and 20:00, followed by the period from 08:00 AM to 12:00 PM. The highest incidence of injuries was recorded among males aged 18-24 years. In our study, in suburban areas, a higher number of RTAs occurred at daytime more than at night, while urban areas experienced a higher number of accidents at night. This trend can be due to several key factors. Suburban roads often serve as connectors for commuters, commercial transport, and school-related travel, leading to higher traffic volumes during daylight hours. Also, there are usually fewer late-night or shift workers and entertainment centers in suburban areas, reducing nighttime traffic. In urban areas, there are vibrant nightlife, extended business hours, and shift work (e.g. healthcare work), increasing nighttime traffic density.
Conclusion
Our findings showed the RTA forecasting performance of ARIMA and PSM models, with PSM proving higher accuracy for both urban and suburban areas. The results highlight the promise of data-driven modeling. The RTA mortality rate is higher in suburban areas of Golestan Province than in its urban areas. This difference indicates the need for deeper exploration of region-specific factors, including emergency service coverage, road infrastructure, and socioeconomic elements, which may not be captured by the forecasting models. Future research should benefit from incorporating spatial analytics or hybrid modeling approaches to better understand these disparities.
Study limitations
This study had some limitations and disadvantages. First, varying service quality across health centers may have led to inconsistent medical reporting. To mitigate this, future studies should employ standardized trauma registries or accredited emergency departments, with sensitivity analyses to assess and exclude lower-quality health centers. Second, integrating diverse data sources (e.g. traffic patterns, accident reports) was challenging due to inconsistent formats and referencing systems. Adopting interoperable data standards, automated cleaning tools, and their testing in pilot studies can improve integration. Third, the underreporting of minor traffic injuries (often due to the absence of medical treatment) may have led to selection bias. Supplementing hospital data with community surveys or law enforcement records, along with statistical methods such as capture-recapture analysis, can address this issue. A prospective study with standardized protocols can further enhance data consistency.
Ethical Considerations
Compliance with ethical guidelines
This study was approved by the Ethics Committee of Golestan University of Medical Sciences, Gorgan, Iran (Code: IR.GOUMS.REC.1402.127). The study followed rigorous ethical standards in examining RTA data through time-series forecasting models. To safeguard victim privacy, all datasets were anonymized, and sensitive personal details were excluded.
Funding
This research did not receive any grant from funding agencies in the public, commercial, or non-profit sectors.
Authors contributions
Conceptualization, study design and initial draft preparation: Manoochehr Babanezhad; Data collection, data aalysis and interpretation: Hassan Khorsha and Ali Mohajervatan; Review, editing and final approval: All authors.
Conflict of interest
The authors declared no conflict of interest.
Acknowledgements
The authors would like to thank Golestan University and the Golestan University of Medical Sciences.
References
- World Health Organization (WHO). Road traffic injuries. 2022 [Updated 2025 August 30]. Available from: [Link]
- Agyemang EF, Mensah JA, Ocran E, Opoku E, Nortey ENN. Time series based road traffic accidents forecasting via SARIMA and Facebook Prophet model with potential changepoints. Heliyon. 2023; 9(12):e22544. [DOI:10.1016/j.heliyon.2023.e22544] [PMID] [PMCID]
- Pardeh MM, Yarmohammadian MH, Atighecian G, Ebrahimi A, Maracy MR. 11-year trend of mortality from fatal road traffic injuries in the center of Iran; A cross-sectional study. Archives of Academic Emergency Medicine. 2024; 12(1):e27. [DOI:10.22037/aaem.v12i1.2205] [PMID]
- Hasani J, Ali Khorshidi A, Erfanpoor S, Nazparvar B, Hashemi Nazari SS. Comparison of risk factors for pedestrian fatality in urban and suburban traffic accidents. Archives Trauma Research. 2018; 7:39-44. [DOI:10.4103/atr.atr_7_18]
- Khosravi Shadmani F, Soori H, Ainy E, Zayeri F, Mehmandar MR. [Comparison of road traffic death occurrence within urban and metropolitan roads focusing on environmental factors (Persian)]. Hakim. 2013; 15(4):339-45. [Link]
- Babanezhad M, Khorsha H, Mohajervatan A, Choori A. Estimating the demand for ambulances in traffic accidents. Health in Emergencies and Disasters Quarterly. 2025; 10(4):247-58. [DOI:10.32598/hdq.10.4.149.8]
- Khorshah H, Eri M, Honarvar MR, Mirkarimi SK, Abbasi M, Badiei F, et al. Epidemiological study of road traffic accidents and detection of accident hot spot in Golestan province, Northern Iran. Journal of Clinical and Basic Research. 2018; 2(4):15-22. [DOI:10.29252/jcbr.2.4.15]
- Afkhaminia F, Yazdani Charati J, Rahimi E, Mousavi Nasab N. [Epidemiological study of the suburban accident mortalities recorded in golestan, Iran in 2015 (Persian)]. Jorjani Biomedicine Journal. 2018; 6(1):67-73. [DOI:10.29252/jorjanibiomedj.6.1.67]
- Yazdani Cherati J, Ahmadi Baseri E, Ghadami M. Mapping of mortality rate in suburban accidents, Mazandaran province, 2007-2010. Journal of Mazandaran University of Medical Sciences. 2013; 22(97):50-8. [Link]
- Mohtasham-Amiri Z, Dastgiri S, Davoudi-Kiakalyeh A, Imani A, Mollarahimi K. An epidemiological study of road traffic accidents in Guilan Province, Northern Iran in 2012. Bulletin of Emergency and Trauma. 2016; 4(4):230-5. [PMID]
- Abbasi HR, Mousavi SM, Taheri Akerdi A, Niakan MH, Bolandparvaz S, Paydar S. Pattern of traumatic injuries and injury severity score in a major trauma center in Shiraz, Southern Iran. Bulletin of Emergency and Trauma. 2013; 1(2):81-5. [PMID]
- Yousefifard M, Toloui A, Ahmadzadeh K, Gubari MI, Neishaboori AM, Amraei F, et al. Risk factors for road traffic injury-related mortality in Iran; A systematic review and meta-analysis. Archives of Academic Emergency Medicine. 2021; 9(1):e61. [DOI:10.22037/aaem.v9i1.1329] [PMID]
- Bakhtiyari M, Mehmandar MR, Riahi SM, Mansournia MA, Sartipi M, Bahadorimonfared A. Epidemiologic Pattern of Fatal Traffic Injuries among Iranian Drivers; 2004-2010. Iranian Journal of Public Health. 2016; 45(4):503-14. [PMID]
- Mehmandar M, Soori H, Amiri M, Norouzirad R, Khabzkhoob M. Risk factors for fatal and nonfatal road crashes in iran. Iranian Red Crescent Medical Journal. 2014; 16(8):e10016. [DOI:10.5812/ircmj.10016] [PMID] [PMCID]
- Najimi-Varzaneh A, Gholami Fesharaki M. Prevalence of road traffic accidents in Iran: A systematic review, GIS and meta-analysis. Iranian Red Crescent Medical Journal. 2018; 20(10):e83852. [DOI:10.5812/ircmj.83852]
- Nassiri H, Mohammadpour SI, Dahaghin M. Forecasting time trend of road traffic crashes in Iran using the macro-scale traffic flow characteristics. Heliyon. 2023; 9(3):e14481. [DOI:10.1016/j.heliyon.2023.e14481] [PMID] [PMCID]
- Ghaneian MT, Tarfiei A, Ehrampoush MH, Lotfi MH, Namayandeh SM, Adamizadeh AR, et al. An epidemiological survey on factors related to traffic accidents in Yazd city, center of Iran (2016-2018). Journal of Occupational Health and Epidemiology. 2021; 10(4):231-8. [DOI: 10.52547/johe.10.4.231]
- Sadeghi-Bazargani H, Ayubi E, Azami-Aghdash S, Abedi L, Zemestani A, Amanati L, et al. Epidemiological patterns of road traffic crashes during the last two decades in Iran: A review of the literature from 1996 to 2014. Archives of Trauma Research. 2016; 5(3):e32985. [DOI:10.5812/atr.32985] [PMID] [PMCID]
- Mohammadi G. Road traffic crash injuries and fatalities in the city of Kerman, Iran. International Journal of Injury Control and Safety Promotion. 2013; 20(2):184-91. [DOI:10.1080/17457300.2012.686039] [PMID]
- Manouchehrifar M, Hatamabadi HR, Derakhshandeh N. Treatment costs of traffic accident casualties in a third-level hospital in Iran; A preliminary study. Emergency. 2014; 2(1):40-2. [PMID]
- Meng G, Liu J, Feng R. Prediction of construction and production safety accidents in china based on time series analysis combination model. Applied Sciences. 2022; 12(21):11124. [DOI:10.3390/app122111124]
- Deretić N, Stanimirović D, Awadh MA, Vujanović N, Djukić A. SARIMA modelling approach for forecasting of traffic accidents. Sustainability. 2022; 14(8):4403. [DOI:10.3390/su14084403]
- Getahun KA. Time series modeling of road traffic accidents in Amhara Region. Journal of Big Data. 2021; 8(1):102. [DOI:10.1186/s40537-021-00493-z]
- Corcuera Hotz I, Hajat S. The effects of temperature on accident and emergency department attendances in London: A time-series regression analysis. International Journal of Environmental Research and Public Health. 2020; 17(6):1957. [DOI:10.3390/ijerph17061957] [PMID] [PMCID]
- Kumar S, Toshniwal D. A novel framework to analyze road accident time series data. Kumar and Toshniwal Journal of Big Data. 2016; 3(8):1-11. [DOI:10.1186/s40537-016-0044-5]
- Huang H, Chen J, Sun R, Wang S. Short-term traffic prediction based on time series decomposition. Physican A. 2022; 585:126441.[DOI:10.1016/j.physa.2021.126441]
- Diaz-Hierro JO, Martín JM, Arenas ÁV, Gonzalez MP, Arevalo JM, González CV. Evaluation of time-series models for forecasting demand for emergency health care services. Emergencias. 2012; 24(3):181-8. [Link]
- Pitarque A, Guillen M. Interpolation of quantile regression to estimate driver’s risk of traffic accident based on excess speed. Risks. 2022; 10(1):19. [DOI:10.3390/risks10010019]
- Al-Azzani MAK, Davari S, England TJ. An empirical investigation of forecasting methods for ambulance calls - A case study. Health Systems. 2020; 10(4):268-85. [DOI:10.1080/20476965.2020.1783190] [PMID] [PMCID]
- Bonifaz JL, Fasanand A. The use of propensity scores matching methodology for analysis of concession: The case of road networks in Peru. Case Studies on Transport Policy. 2023; 10:2350-7. [DOI:10.1016/j.cstp.2022.10.017]
- Khorsha H, Babanezhad M, Behnampour N. Evaluation of the causal association of risk factors for death from COVID-19 patients admitted to Golestan hospitals by propensity score estimation method. Iranian Journal Health Sciences. 2023; 11(4):279-88. [DOI:10.32598/ijhs.11.4.567.3]
Type of Study: Original Article |
Subject:
Biostatistics
Send email to the article author
| Rights and permissions | |
 |
This work is licensed under a Creative Commons Attribution-NonCommercial 4.0 International License. |

This is an open access article distributed under the terms of the Creative Commons Attribution License (CC-By-NC), which permits use, distribution, and reproduction in any medium, provided the original work is properly cited and is not used for commercial purposes.
Contact Information
