

Volume 14, Issue 1 (Winter 2026)
Iran J Health Sci 2026, 14(1): 75-84 |
Back to browse issues page


Ethics code: ID: IR.ABADANUMS.REC.1401.132
Download citation:
BibTeX | RIS | EndNote | Medlars | ProCite | Reference Manager | RefWorks
Send citation to:


BibTeX | RIS | EndNote | Medlars | ProCite | Reference Manager | RefWorks
Send citation to:
Nosrati M A, Zaheri H R, Kamyari N, Goudarzi G, Maleki H, Radmanesh E. Impact of Particulate Matter Exposure on Diagnostic Biomarkers in Patients With Chronic Obstructive Pulmonary Disease. Iran J Health Sci 2026; 14 (1) :75-84
URL: http://jhs.mazums.ac.ir/article-1-1046-en.html
URL: http://jhs.mazums.ac.ir/article-1-1046-en.html
Mohammad Amin Nosrati 

 , Hamid Reza Zaheri , Naser Kamyari , Gholamreza Goudarzi , Heydar Maleki , Esmat Radmanesh *
, Hamid Reza Zaheri , Naser Kamyari , Gholamreza Goudarzi , Heydar Maleki , Esmat Radmanesh *
Department of Physiology, School of Medicine, Abadan University of Medical Sciences, Abadan, Iran. , esmatradmanesh33@gmail.com, e.radmanesh@abadanums.ac.ir
Full-Text [PDF 789 kb]
(199 Downloads)
| Abstract (HTML) (485 Views)
Full-Text: (155 Views)
Introduction
Chronic obstructive pulmonary disease (COPD) is a leading cause of death worldwide. It is caused by exposure to harmful respiratory particles, especially tobacco smoke and pollutants [1]. COPD encompasses small airway obstruction, chronic bronchitis, and emphysema. The primary pathological basis of this disease involves inflammation, bronchial mucosal epithelial damage, and irreversible airflow limitation [2]. Among the risk factors found for COPD are air pollution, occupational dust exposure, smoking, low BMI, indoor biomass burning, diet, and childhood asthma [3]. Various natural or human processes create suspended particles. Artificial sources of suspended particles in urban areas include various industries such as iron, coal, cement, smelting, plaster factories, and large lathe workshops [4]. Particles with an aerodynamic diameter of less than 2.5 μm (PM2.5) pose a significant risk to human health. PM2.5 is mostly absorbed through the respiratory system, where it can penetrate the alveoli of the lungs and enter the bloodstream [5]. Exposure to air pollution is one of the main factors in the pathogenesis of COPD worldwide.
Recent estimates suggest that 50% of all COPD risks may be attributable to air pollution [6]. The prevalence of COPD attributed to particulate matter (PM) decreased from 2009 to 2013 in Ahvaz City, the capital of Khuzestan Province in southwestern Iran. As a result, reducing air pollutants, especially PM10, a major risk factor, can lead to significant reductions in mortality and morbidity, including COPD attributed to PM10 [7]. Abadan is a city situated in Khuzestan Province, in southwestern Iran. The region has experienced an increase in dust storms, largely due to its proximity to vast deserts in Saudi Arabia and southern Iraq, as well as local drought conditions that have persisted in recent years. Since no comprehensive study has been conducted to date on the effects of PM on liver, kidney, and coagulation laboratory markers in patients with COPD, there is a clear need for such a study. By studying this research, it is possible to predict future problems in patients with COPD and prevent their consequences by adopting appropriate strategies.
Materials and Methods
In this study, after obtaining the necessary permits, information on COPD patients was obtained by referring to the medical records department, hospital information system (HIS), and reviewing patients’ files in educational hospitals affiliated with Abadan University of Medical Sciences (Ayatollah Taleghani Educational Hospital of Abadan, Shahid Beheshti Educational Hospital of Abadan, and Valiasr Educational Hospital of Khorramshahr). All 270 patients who met the inclusion and exclusion criteria during the study period (March 21, 2022–March 20, 2023) were included.
The Abadan Environment Department provided information on air pollutant levels, specifically PM10 and PM2.5, from March 21, 2022, to March 20, 2023. These data were used to investigate the correlation between PM levels and clinical and laboratory markers in patients with COPD. The inclusion criteria for patients with COPD who were admitted to the educational hospitals of Abadan University of Medical Sciences from March 21, 2022, to March 20, 2023, along with their laboratory and clinical information, were available. The exclusion criterion for this study was patients with incomplete clinical and laboratory information.
The data are organized by admission date, sex, age, type of disease, clinical and laboratory markers, and concentration of PM10 and PM2.5. Duplicate entries were removed, the information was entered into Excel, and the results were analyzed using SPSS software, version 25. The study investigates the relationship between PM and laboratory and clinical markers in patients with COPD who were admitted between March 21, 2022, and March 20, 2023.
The mass concentration of PM was measured using a Met One Beta Attenuation Meter (BAM-1020) (Hafkenscheid & Vonk). The air quality monitoring station was situated on the rooftop of the Abadan Environmental Protection Agency office, approximately 10 meters above ground level. Sampling was conducted hourly over 24 hours each day. The mean annual PM concentrations were collected from March 21, 2022, to March 20, 2023, to assess air quality during this timeframe. Additionally, meteorological parameters were obtained from the Iran Meteorological Organization (IRIMO) to analyze the relationship between these variables and PM concentrations. The meteorological station was located at Abadan International Airport.
Before data extraction, we conducted an a priori power calculation to ensure a sufficient sample size for detecting an association between PM exposure and biomarker levels. We assumed a small effect size (|r|=0.2), a 2-sided significance level of α=0.05, and a statistical power (1-β)=0.95, consistent with conventions in observational epidemiology. The required sample size under these assumptions was estimated to be approximately 262 participants. Our final sample included 270 eligible patients, exceeding the calculated requirement.
After data collection, all analyses were conducted using IBM SPSS Statistics for Windows, version 25.0 (IBM Corp., Armonk, NY, USA). Descriptive statistics were used to summarize the data: qualitative variables were expressed as frequencies and percentages, and quantitative variables were reported as Mean±SD. The assumption of normality for quantitative variables was evaluated using the Kolmogorov-Smirnov test. Categorical variables were compared using the chi-square test or Fisher exact test when appropriate. Differences in means between two groups were assessed with independent-samples t-tests, while comparisons across more than two groups were performed using one-way analysis of variance (ANOVA). To examine the relationship between ambient PM concentrations (PM10 and PM2.5) and clinical and laboratory variables, multiple linear regression analyses were performed. Two modeling strategies were applied: a full model including all candidate predictors using the Enter method, and a reduced model obtained by excluding variables with evidence of severe multicollinearity and applying the Stepwise method. In all regression models, unstandardized coefficients (B), standard errors (SE), and P values were reported. Model assumptions were checked by examining variance inflation factors (VIF) to assess multicollinearity (with all final VIF values <2) and by using the Durbin–Watson statistic to confirm independence of residuals. All statistical tests were 2-sided, and P<0.05 were considered statistically significant.
Results
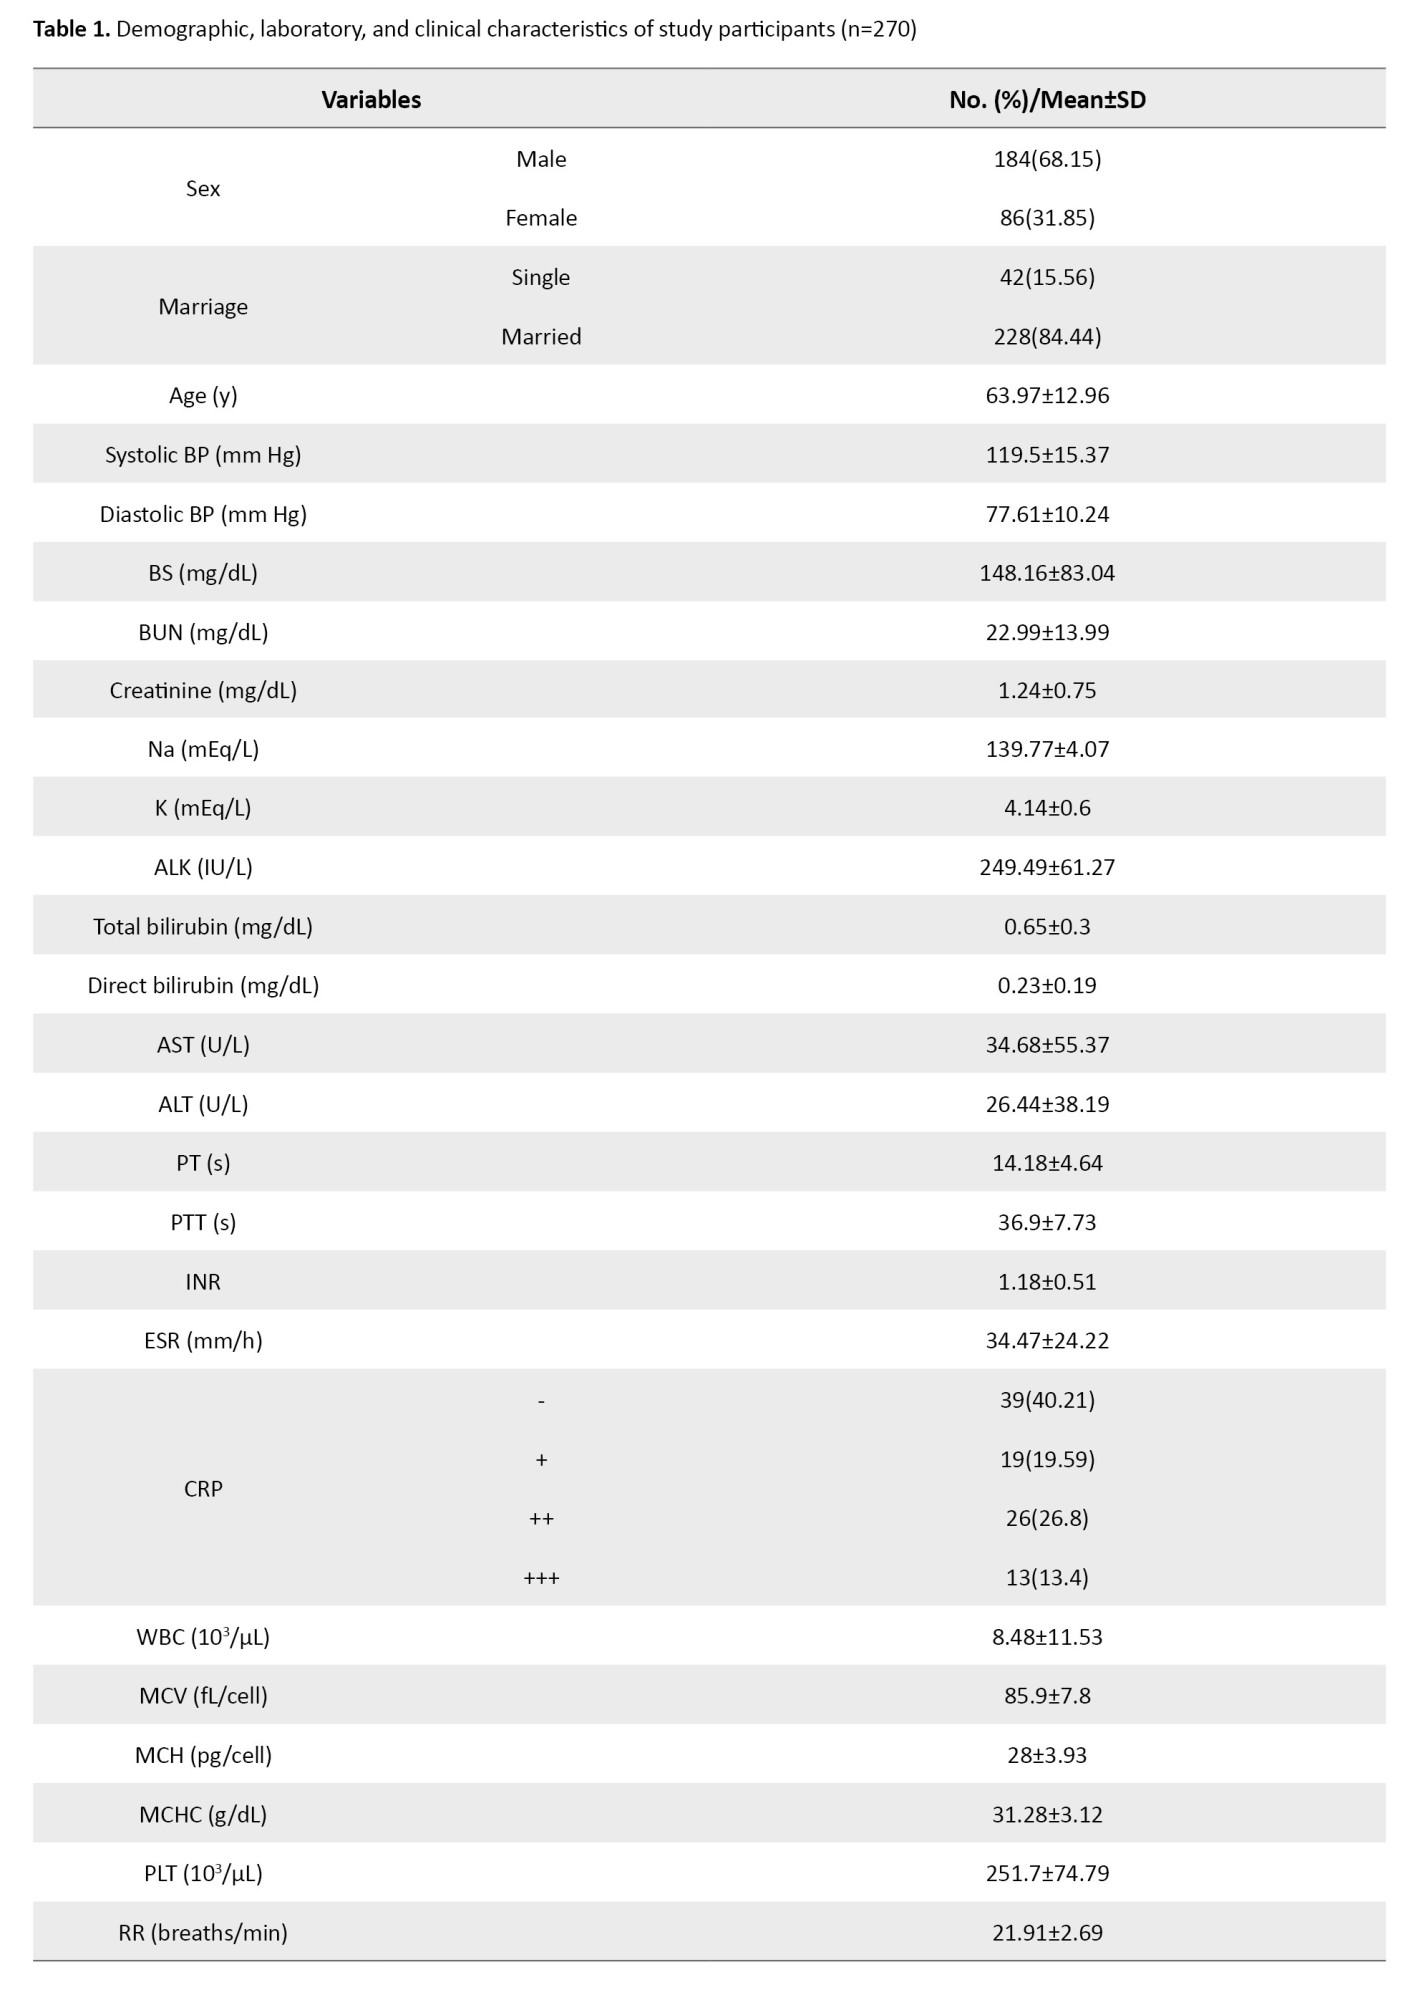
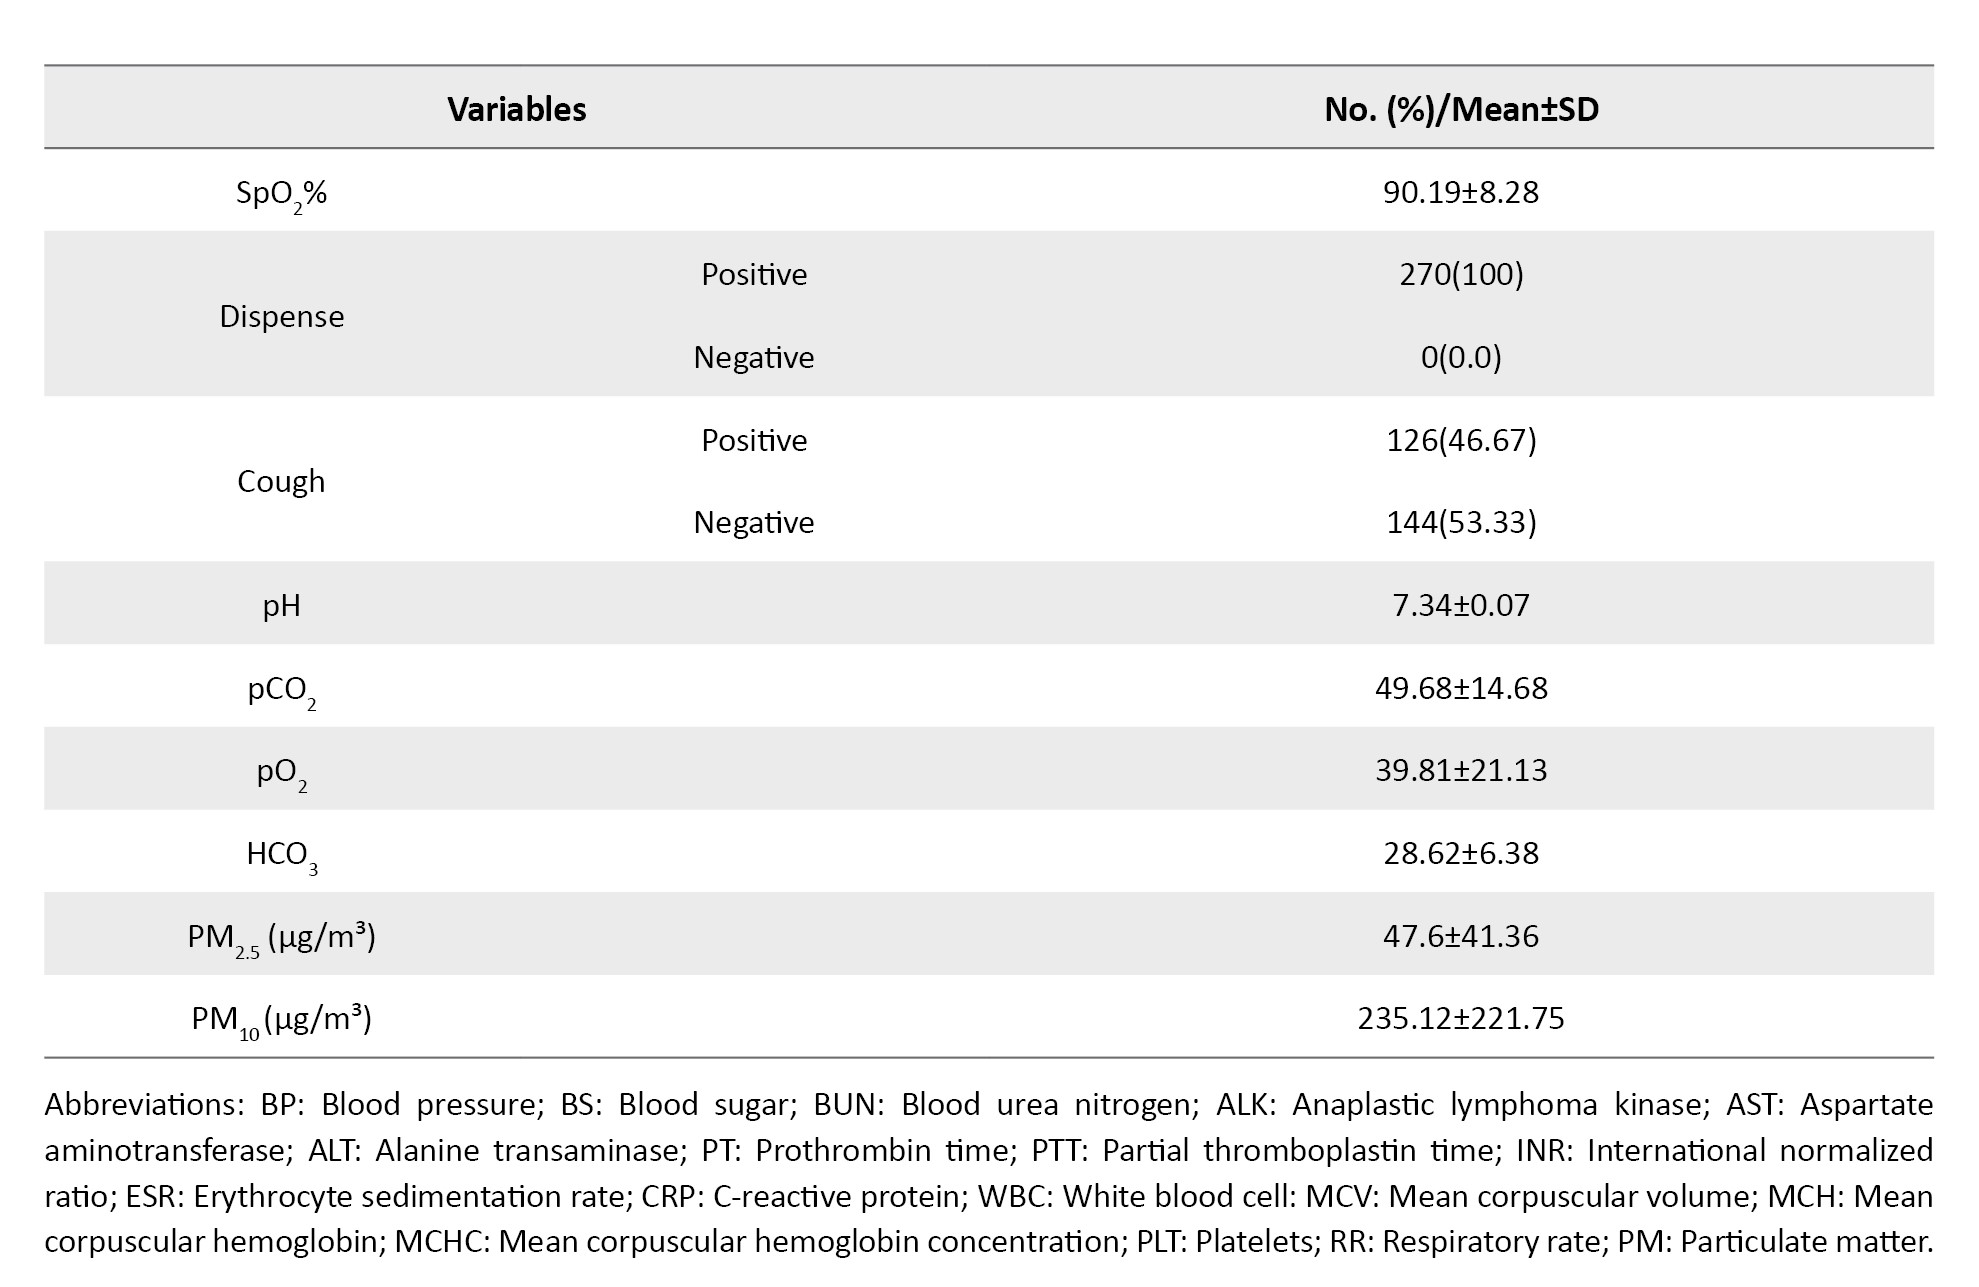
In this study, 270 patients with COPD were examined. Of these, 184(68.15%) were male, and 86(31.85%) were female, with a higher frequency among males.
The mean age of the patients with COPD was 63.97±12.96 years. The mean systolic blood pressure in these patients is 119.5±15.37 mm Hg, and the mean diastolic blood pressure is 77.61±10.24 mm Hg. The blood sugar (BS) level was 148.16±83.04 (mg/dL), which was higher than the normal mean. The mean of blood urea nitrogen (BUN) was reported as 22.99±13.99 (mg/dL), which is higher than the normal mean, and the mean of alkaline phosphatase (ALP) was 249.49±67.21 (mg/dL), which is higher than the normal level. The mean prothrombin time (PT) was 14.18±4.64 (s), which is higher than the normal. The mean of erythrocyte sedimentation rate (ESR) 34.47±24.22 (mm/h) in this study was higher than the normal mean. The mean pCO2 was also higher than normal (49.68±14.68). The HCO3 mean (28.6±6.38) is also higher than the normal. The mean SpO2 value is reported to be 90.19±8.28, which is lower than the normal mean. The number of breaths per minute was higher than normal (21.91±2.69). Shortness of breath was commonly observed in patients. Also, C-reactive protein (CRP) was +19%, ++26%, +++13% (Table 1).
In Table 2, we report statistical associations between PM10 concentrations and laboratory/clinical markers in COPD patients.
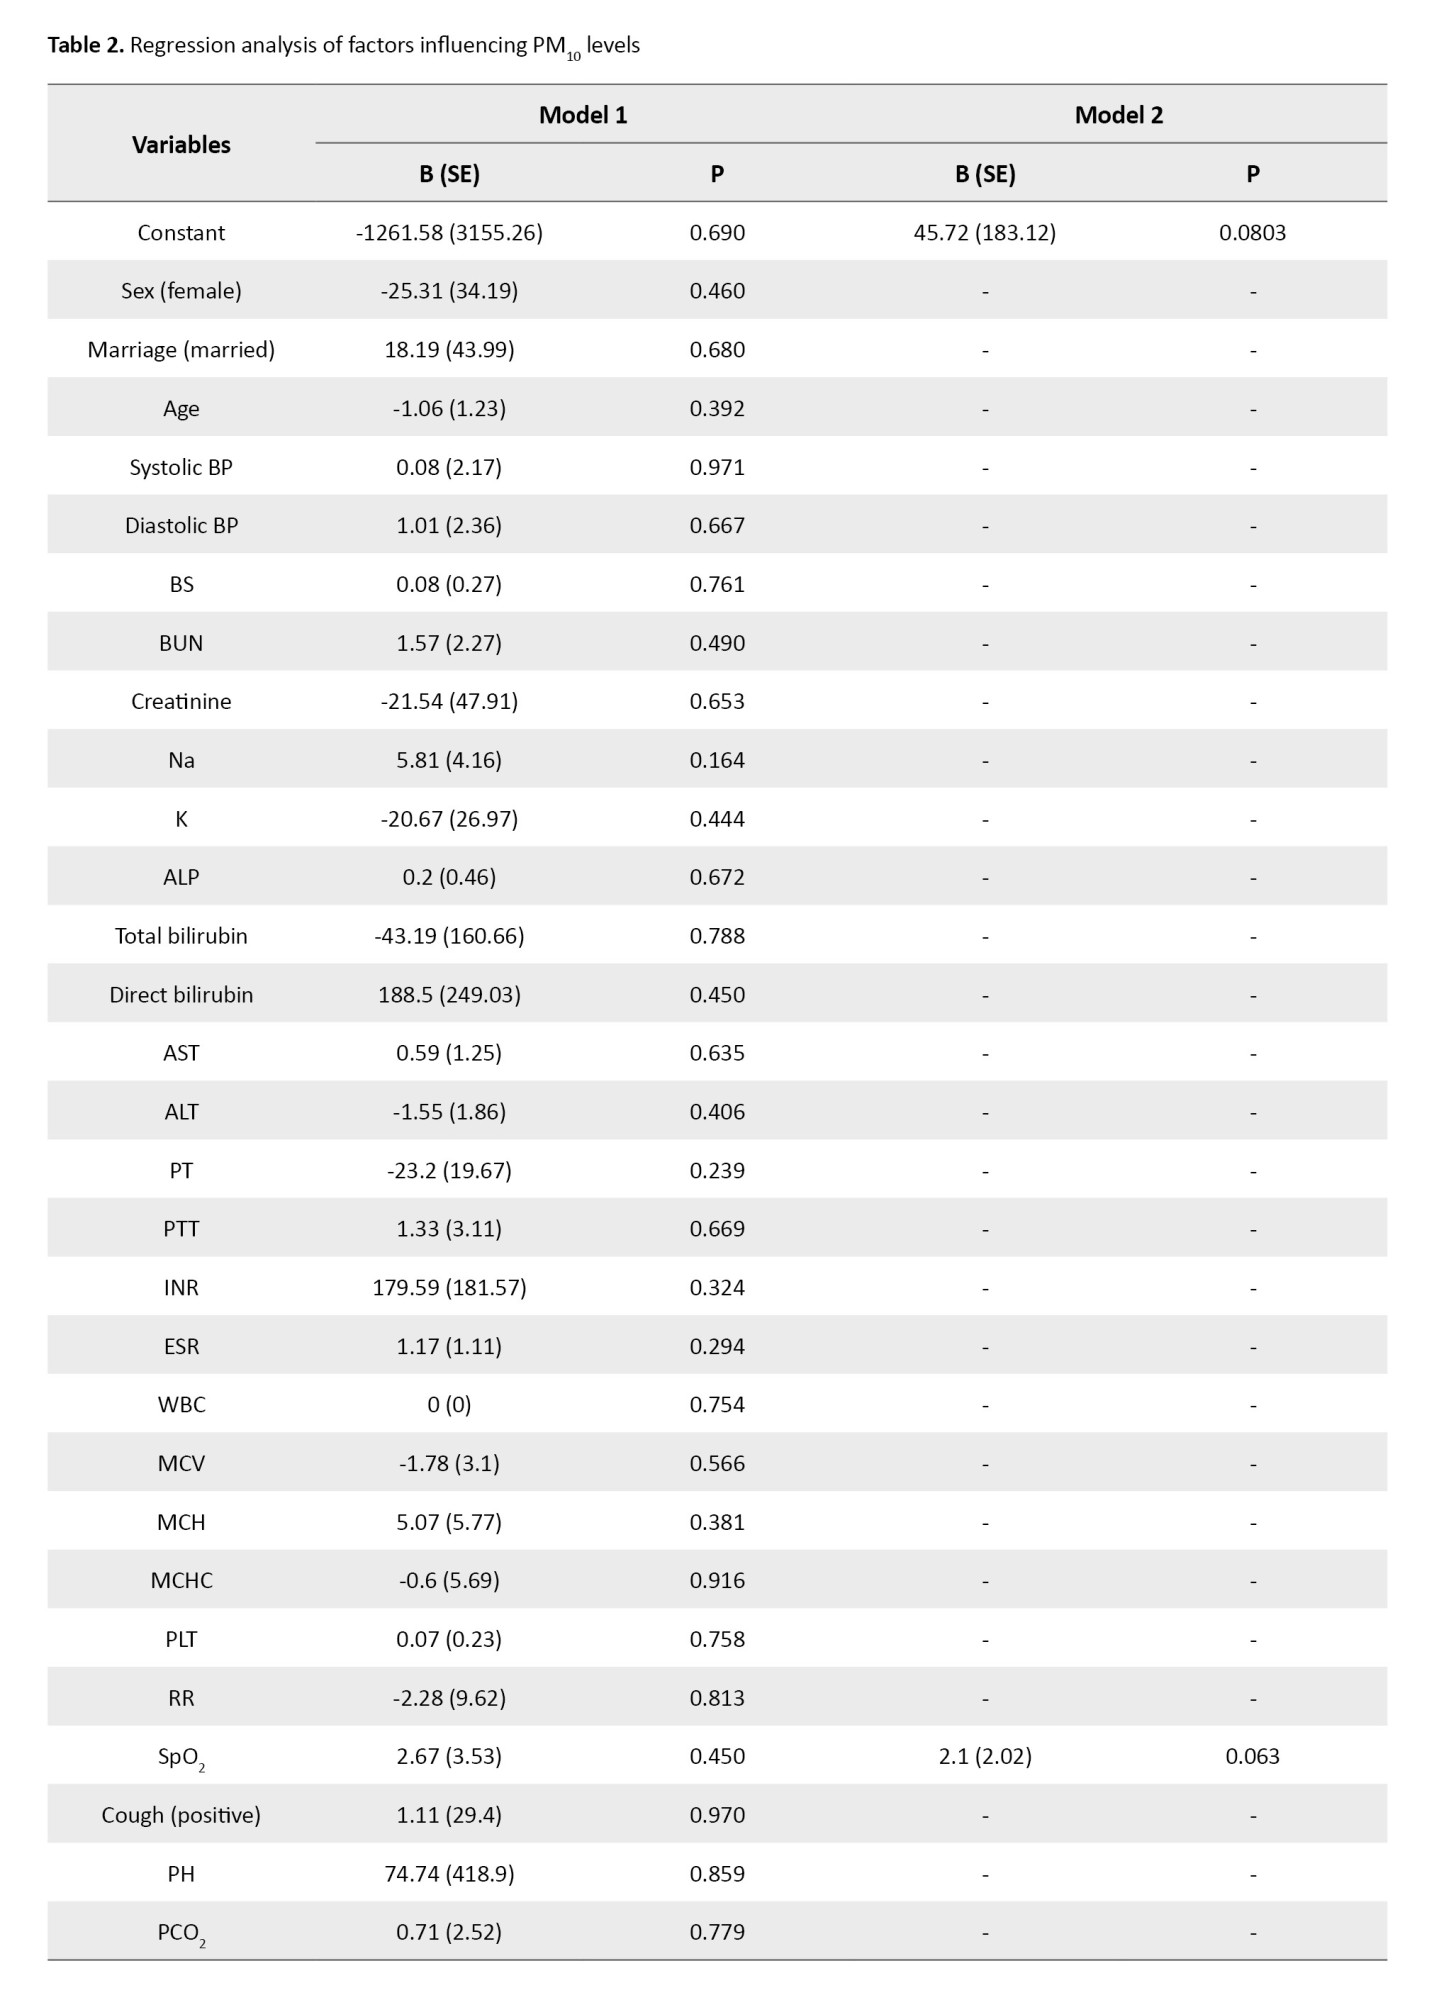
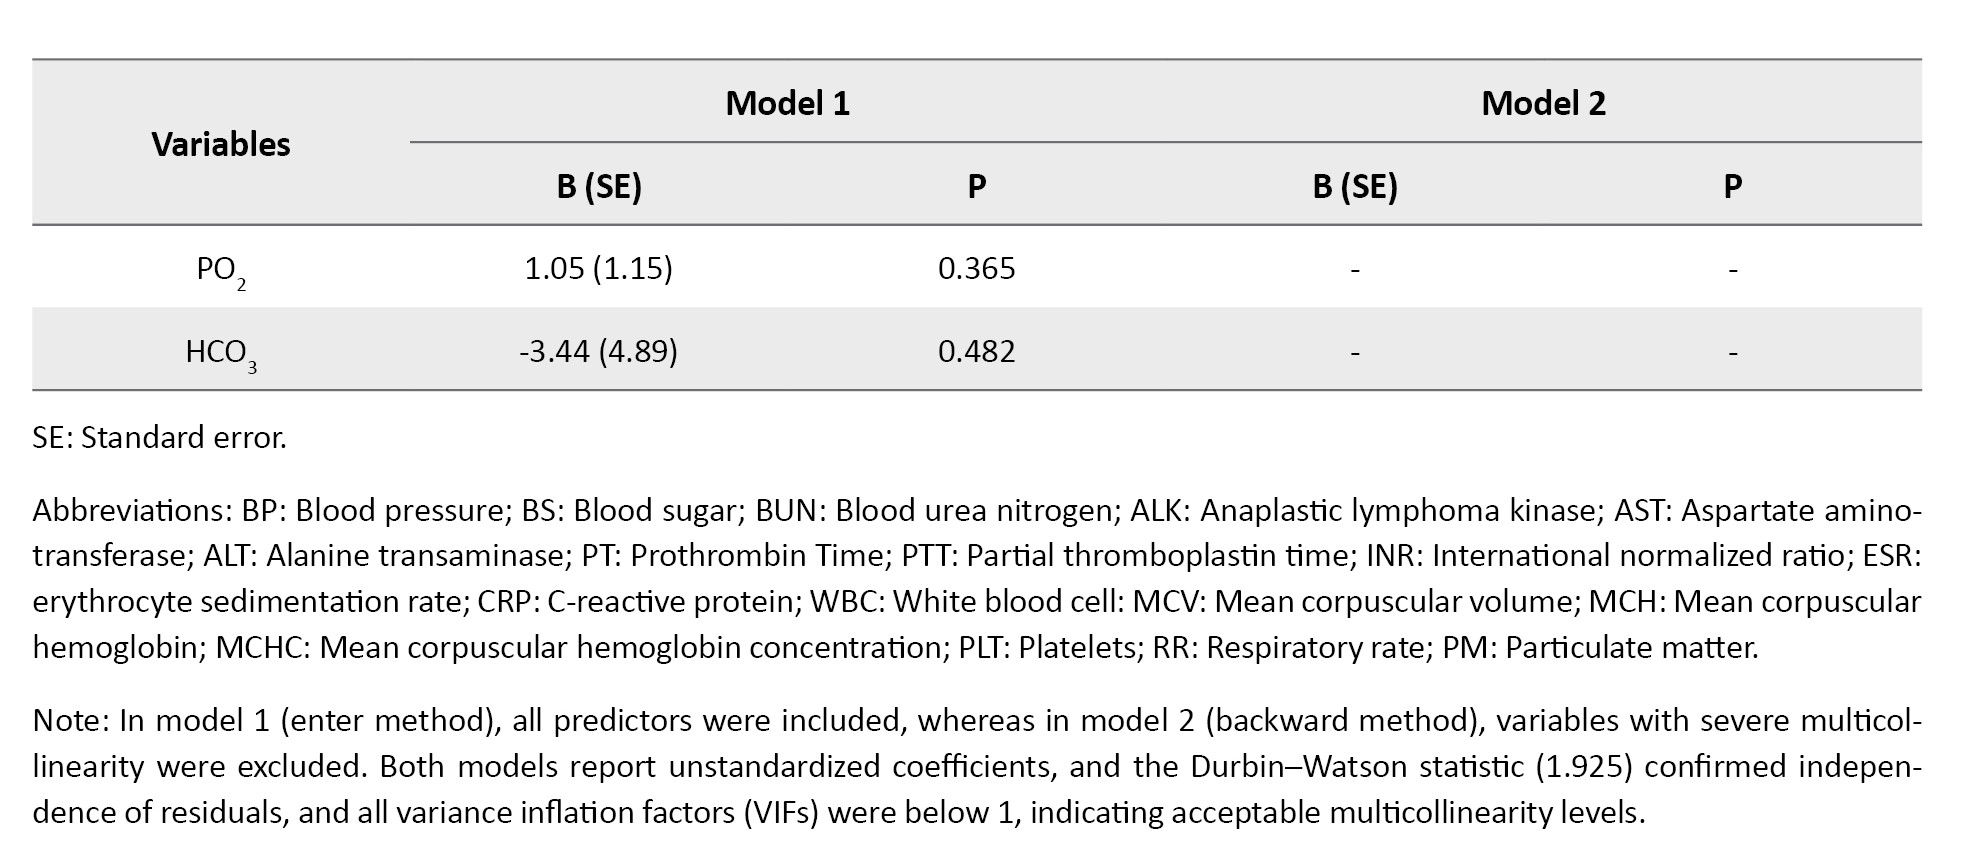
In model 1 (enter method), none of the predictors were significantly associated with PM10 levels. In model 2 (stepwise method, collinearity-adjusted), only arterial oxygen saturation (SpO2) approached significance, where each 1% increase in SpO2 was associated with an average increase of 2.10 µg/m³ in PM10 (P=0.063). Although not statistically significant at the 0.05 threshold, this result suggests a possible positive correlation between higher SpO2 and PM10 levels. Higher values of systolic pressure, BUN, and ESR tended to co-occur with higher PM10 levels; specifically, each 1-unit increase in systolic pressure, BUN, and ESR was associated with mean increases of 0.8 µg/m³, 1.57 µg/m³, and 1.17 µg/m³ in PM10, respectively. However, none of these associations reached statistical significance. Other clinical and laboratory parameters showed no significant relationship with PM10 (Table 2).
In Table 3, in model 1 (enter method), significant associations were observed for blood sugar, alanine transaminase (ALT), and ESR.
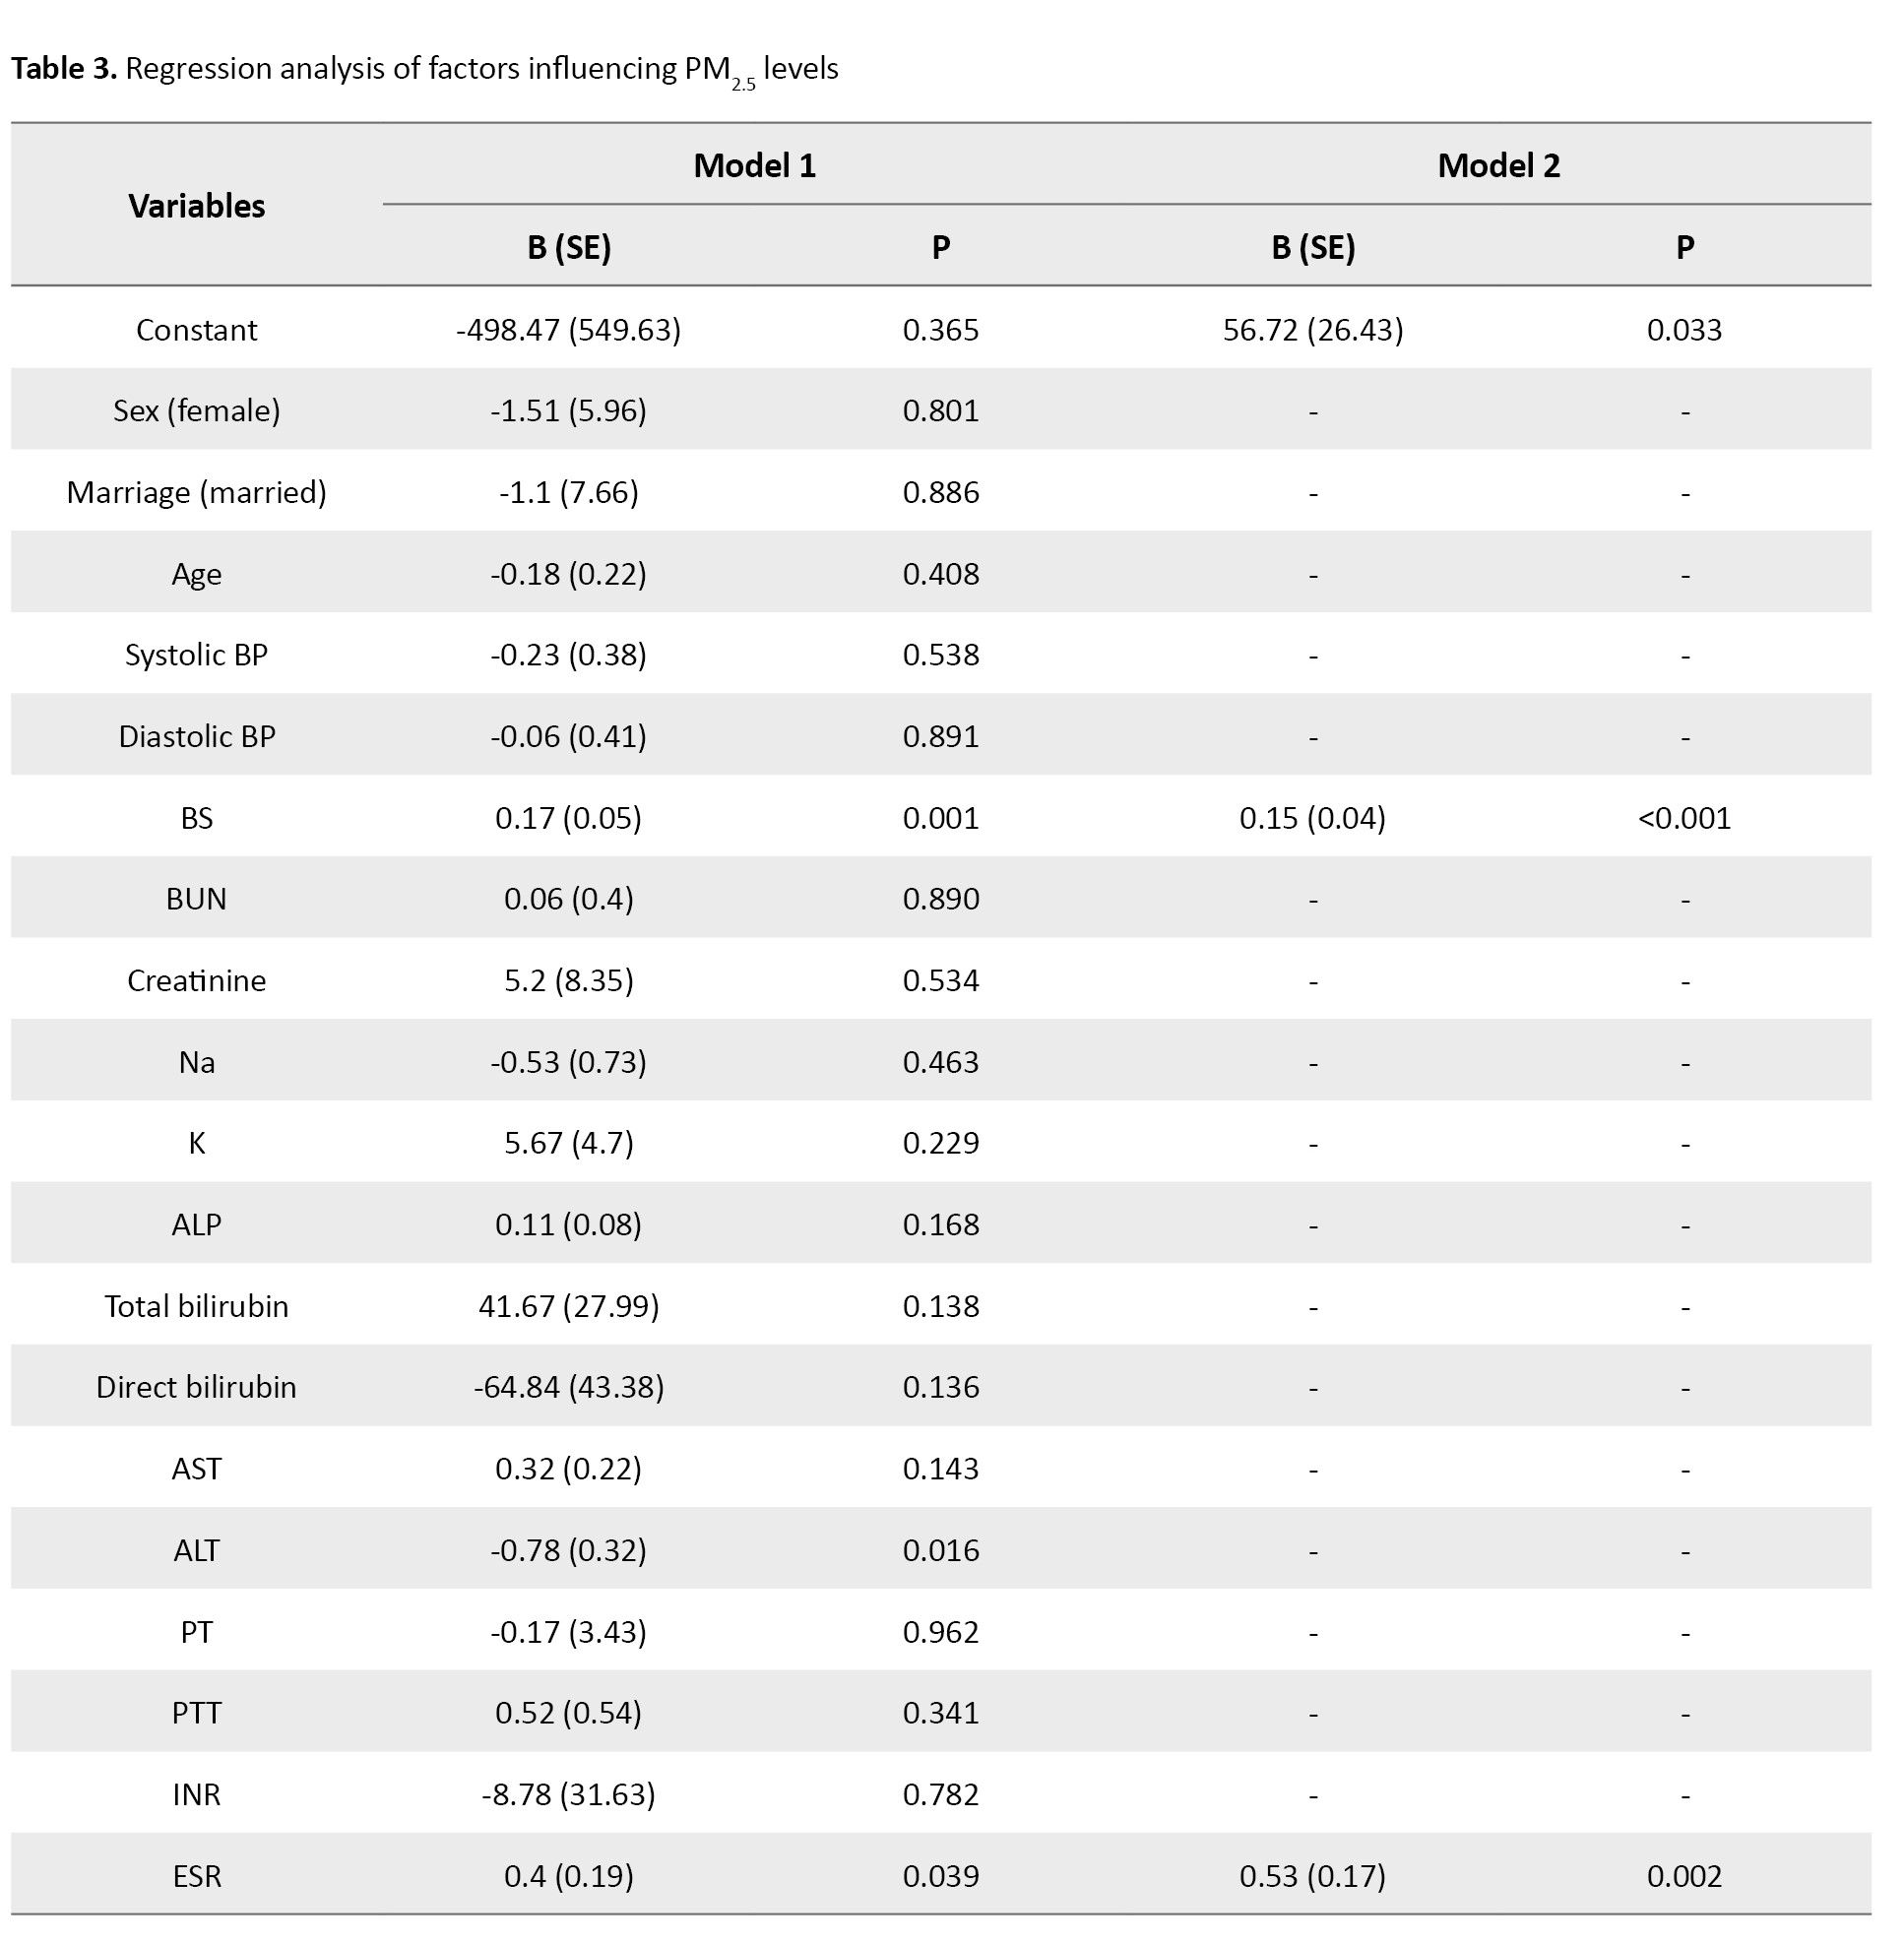
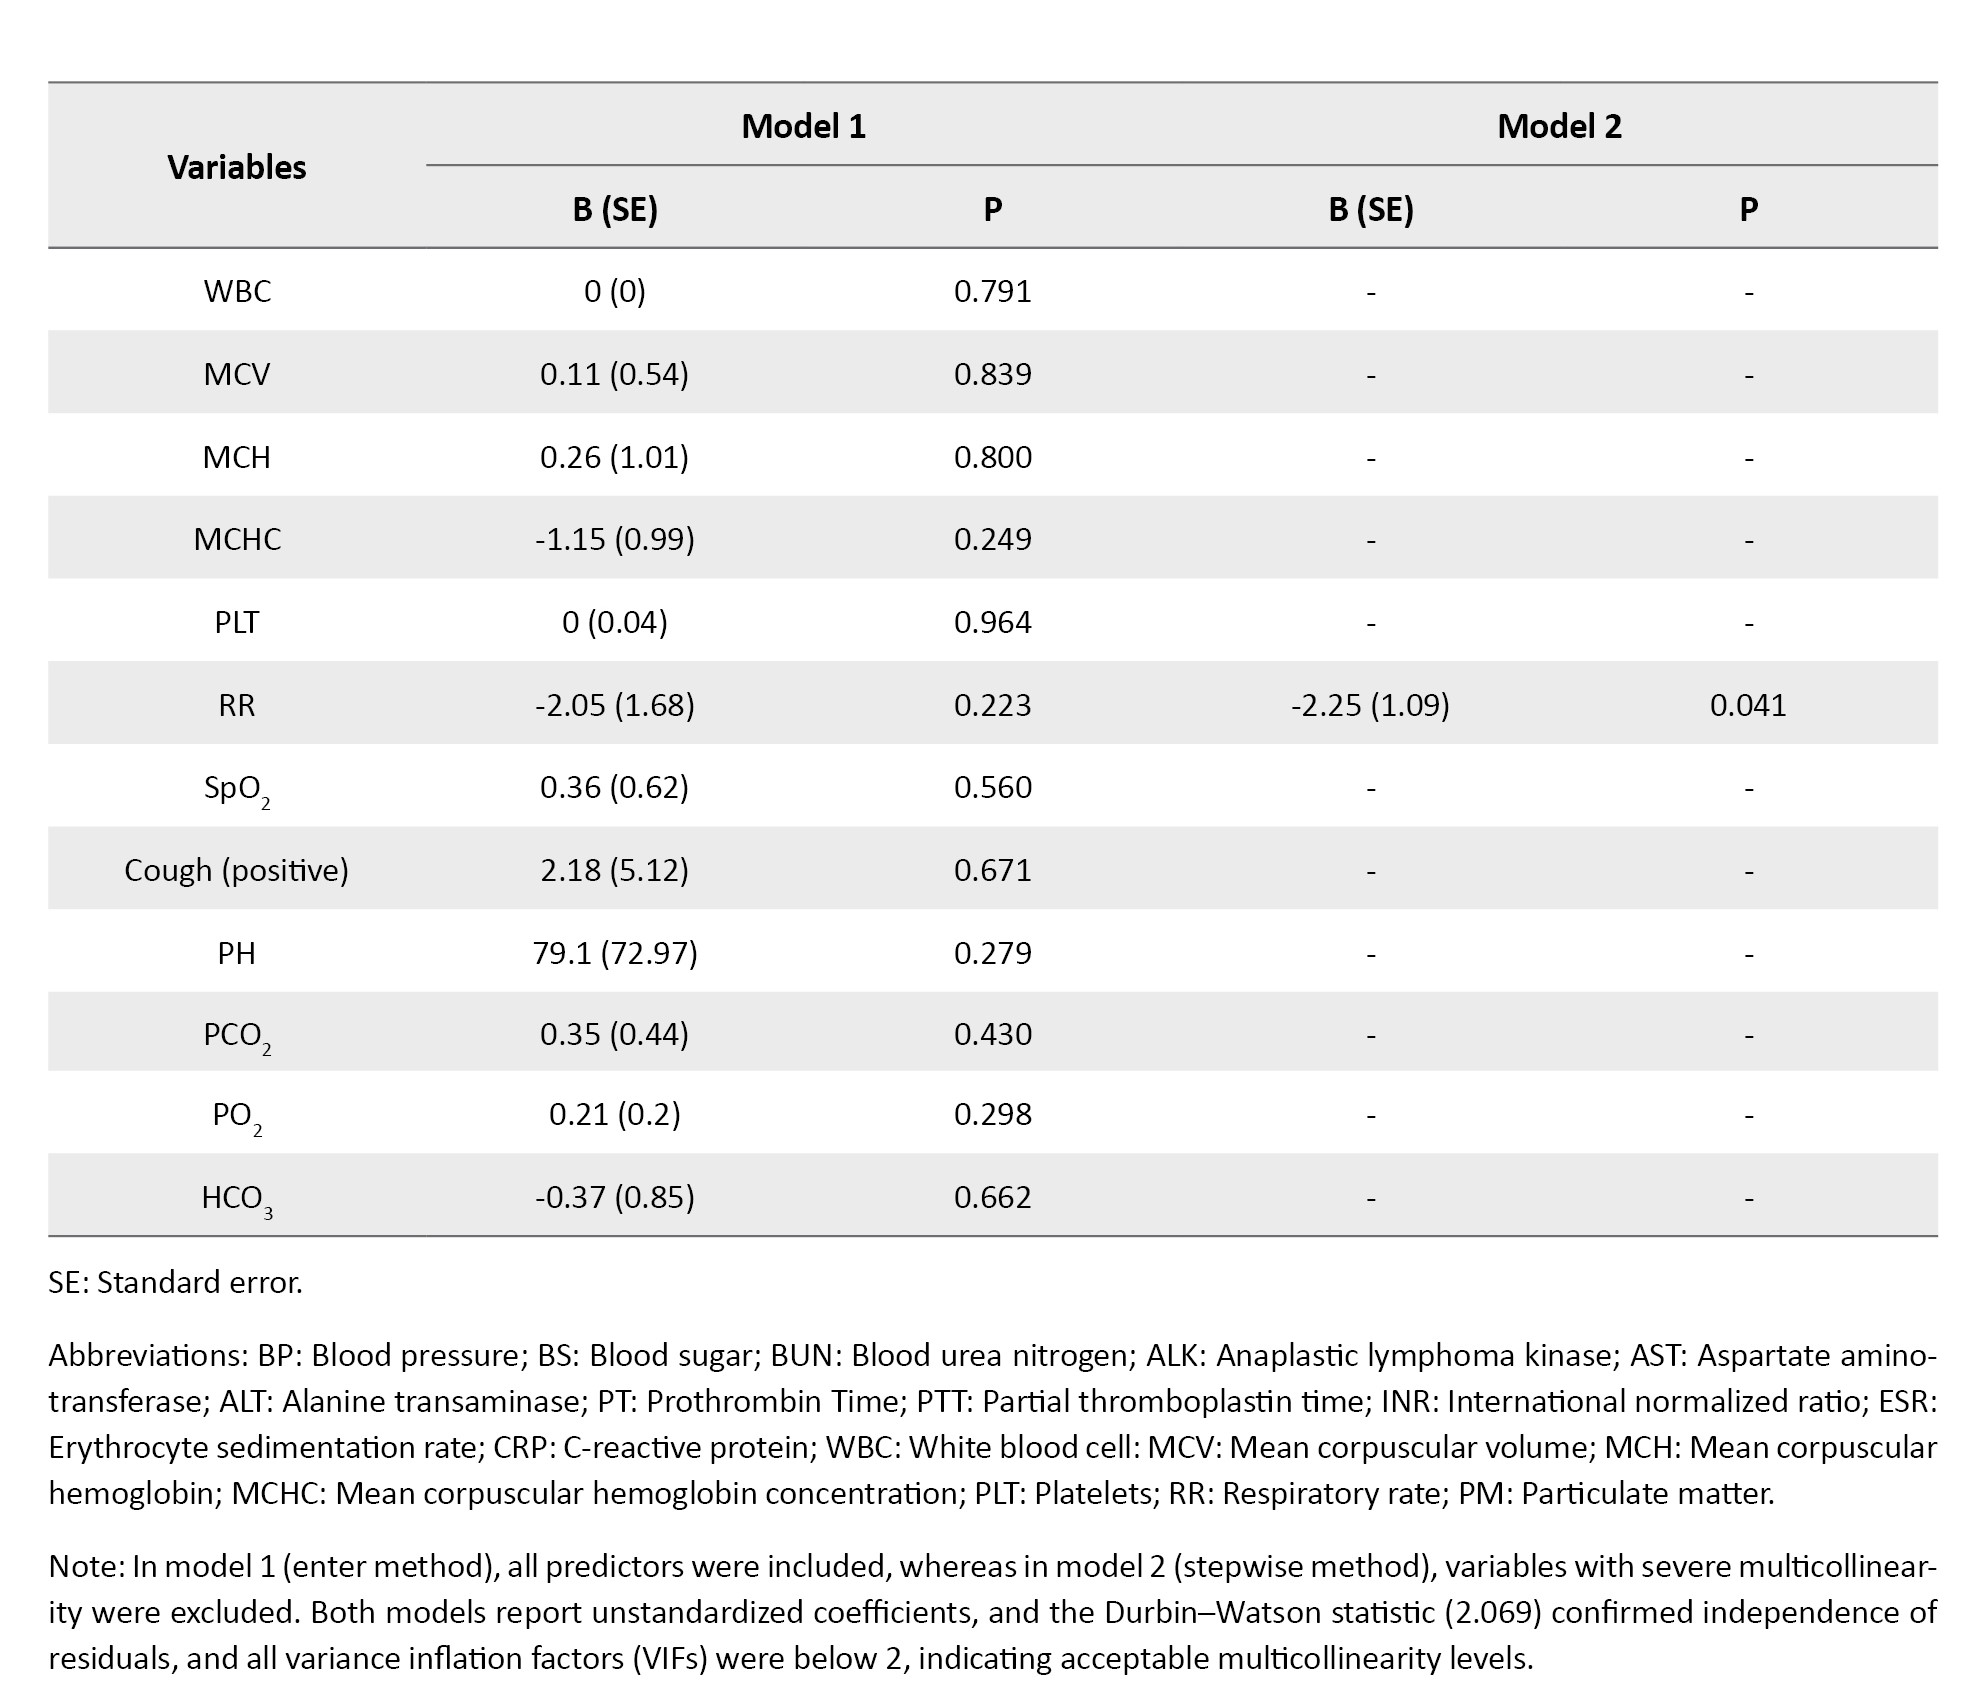
Specifically, each 1 mg/dL increase in BS was associated with a 0.17 µg/m³ higher PM2.5 concentration (P=0.001). ALT was inversely associated with PM2.5, where each 1 U/L increase in ALT corresponded to a 0.78 µg/m³ lower PM2.5 (P=0.016). ESR was positively associated with PM2.5, with each 1 mm/h increase in ESR corresponding to a 0.40 µg/m³ higher PM2.5 (P=0.039). In model 2 (stepwise method), these associations remained robust: BS was again positively associated with PM2.5 (B=0.15, P<0.001), ESR remained positively associated (B=0.53, P=0.002), and ALT retained its negative association (B=–0.78, P=0.016). Additionally, respiratory rate (RR) emerged as significant, with each one-unit increase in RR associated with a 2.25 µg/m³ lower PM2.5 concentration (P=0.041).
Discussion
In the present study, 270 patients with COPD were examined in educational hospitals of Abadan University of Medical Sciences. Shortness of breath was the most common symptom in these patients.
Among the laboratory markers of blood sugar, PT, BUN, and ALP were higher than the normal mean. ESR and CRP values were higher than normal. The mean pCO2 was also higher than normal, indicating respiratory acidosis, and the mean HCO3 was also higher than the normal mean, indicating metabolic alkalosis. Also, SpO2 has been reported as 90, which is lower than the normal mean.
No significant changes in laboratory or clinical markers were observed with increasing PM10 levels in COPD patients. For each unit increase in PM2.5, significant changes in blood sugar, BUN, ALT, and ESR were observed.
A study by Zhang J et al. showed that BUN levels were elevated in subjects with COPD [8]. Additionally, Giri et al. demonstrated that BUN levels were high in people with COPD, and these high levels were associated with an increased risk of mortality in COPD patients [9]. Furthermore, Du et al. reported that high BUN levels (above 40) were associated with longer hospital stays in patients with COPD [10]. In our study, the BUN level was higher than the normal mean.
According to a study by Tang et al., long-term exposure to PM10 is associated with a higher incidence of hyperuricemia and increased creatinine [11]. A 2025 meta-analysis by Li et al. found that long-term exposure to PM2.5 is associated with increased serum creatinine (SCr) and uric acid (UA). In contrast, short-term exposure to PM2.5 is associated with decreased estimated glomerular filtration rate (eGFR) and increased BUN [12]. Furthermore, in our study, we observed a significant increase in BUN for each unit rise in PM2.5.
Peng et al. discovered that exposure to PM2.5 can affect renal function by activating oxidative stress pathways [13]. Oxidative stress and inflammatory responses can accelerate the breakdown of structural proteins and amino acids, thereby increasing BUN production [14].
Wang L et al.’s study showed that serum ESR levels can predict the severity of COPD in elderly patients. In individuals with COPD, ESR levels were found to be higher than the normal mean [15]. In our study, we also found that the ESR levels were higher than the normal mean. Dehe et al indicated that individuals with COPD had lower SpO2 levels than the normal mean [16]. Our study findings support this conclusion.
Yang et al.’s study shows that levels of AST and D-dimer in people with COPD are higher than the normal mean [17]. In our study, the AST level was within the normal range. A study by Wang et al. found that long-term exposure to PM2.5 was associated with increased AST levels [18]. In our study, we did not observe significant changes in AST levels with increasing PM exposure.
Zhang et al. found that long-term exposure to PM2.5 is associated with higher ALT and AST levels [19]. Similarly, Kim et al. demonstrated that an increase in PM concentration is associated with a 2.3% increase in ALT and a 3% increase in AST [20]. Our study also found a significant increase in ALT with each unit rise in PM2.5.
Direct effects of PM on hepatocytes include induction of oxidative stress, DNA strand breaks, alterations in lipid metabolism, and promotion of a pro-inflammatory milieu [21]. In a study by Choi et al., low ALT levels are found to be a risk factor for the development of COPD. The study suggests that individuals with low ALT should be screened for COPD [22]. Additionally, Lasman et al found that ALT levels are low in people with COPD [23]. However, in our study, ALT levels were normal.
Bermudez et al. revealed that individuals with COPD have elevated blood sugar levels [24]. In our research, we observed higher-than-normal mean blood sugar levels. Bo et al.’s 2021 study demonstrated that lower PM2.5 levels are associated with lower blood sugar, while higher levels are associated with higher blood sugar [25]. Lee et al. found that exposure to PM2.5 was linked to an increased risk of diabetes and higher blood sugar levels [26]. Shen et al. study demonstrated that exposure to PM2.5 particles exceeding 5 μg/m3 is associated with elevated FBS levels and an increased risk of diabetes [27]. In our research, for each unit increase in PM2.5, we observed a significant increase in blood sugar.
Oxidative stress is recognized as a risk factor for metabolic syndrome and is also a consequence of exposure to air pollution. This condition provides a plausible explanation for the observed connections between air pollution and diabetes [28].
Due to the absence of a control group in the current study, it is suggested that case-control studies with large sample sizes be conducted to compare laboratory, liver, kidney, etc. indicators in patients with COPD. To compare these Indicators, the independent risk factors affecting the death of this patient group should also be identified. Also, future research should involve a larger sample size and encompass a broader range of locations. Furthermore, the impact of other air pollutants should be explored.
Conclusion
In patients with COPD, some renal, hepatic, and inflammatory laboratory markers were abnormal. A significant association was identified between PM and several of these laboratory markers, including blood sugar, ALT, and ESR. However, further extensive studies are necessary to explore this area more thoroughly. Implementing air pollution control strategies is crucial for the health of these patients, and it is essential to provide appropriate care for COPD patients on days with high pollution levels.
Study limitations
This study has several limitations, including its retrospective design, which may have introduced selection bias due to reliance on hospital records. In addition, important confounding variables such as smoking habits, comorbidities, medication use, and duration or severity of COPD were not available in the medical records. They were not controlled for in the analysis. These factors could have influenced the observed associations between PM exposure and laboratory markers.
Ethical Considerations
Compliance with ethical guidelines
This study was approved by the Research Ethics Committee of Abadan University of Medical Sciences, Abadan, Iran (Code: IR.ABADANUMS.REC.1401.132).
Funding
This research did not receive any grant from funding agencies in the public, commercial, or non-profit sectors.
Authors contributions
Conceptualization and project administration: Esmat Radmanesh; Data curation: Mohammad Amin Nosrati, Esmat Radmanesh, and Heydar Maleki; Formal analysis: Naser Kamyari; Writing the original draft: Esmat Radmanesh, Mohammad Amin Nosrati, and Naser Kamyari; Methodology, investigation, review and editing: All authors.
Conflict of interest
The authors declared no conflict of interest.
Acknowledgements
The authors gratefully acknowledge the Abadan Environmental Protection Department, the Khuzestan Environmental Department, the Iran Meteorological Organization (IRIMO), the Clinical Research Development Unit of Taleghani Educational Hospital, the Clinical Research Development Unit of Valiasr Educational Hospital, and Shahid Beheshti Educational Hospital of Abadan University of Medical Sciences.
Chronic obstructive pulmonary disease (COPD) is a leading cause of death worldwide. It is caused by exposure to harmful respiratory particles, especially tobacco smoke and pollutants [1]. COPD encompasses small airway obstruction, chronic bronchitis, and emphysema. The primary pathological basis of this disease involves inflammation, bronchial mucosal epithelial damage, and irreversible airflow limitation [2]. Among the risk factors found for COPD are air pollution, occupational dust exposure, smoking, low BMI, indoor biomass burning, diet, and childhood asthma [3]. Various natural or human processes create suspended particles. Artificial sources of suspended particles in urban areas include various industries such as iron, coal, cement, smelting, plaster factories, and large lathe workshops [4]. Particles with an aerodynamic diameter of less than 2.5 μm (PM2.5) pose a significant risk to human health. PM2.5 is mostly absorbed through the respiratory system, where it can penetrate the alveoli of the lungs and enter the bloodstream [5]. Exposure to air pollution is one of the main factors in the pathogenesis of COPD worldwide.
Recent estimates suggest that 50% of all COPD risks may be attributable to air pollution [6]. The prevalence of COPD attributed to particulate matter (PM) decreased from 2009 to 2013 in Ahvaz City, the capital of Khuzestan Province in southwestern Iran. As a result, reducing air pollutants, especially PM10, a major risk factor, can lead to significant reductions in mortality and morbidity, including COPD attributed to PM10 [7]. Abadan is a city situated in Khuzestan Province, in southwestern Iran. The region has experienced an increase in dust storms, largely due to its proximity to vast deserts in Saudi Arabia and southern Iraq, as well as local drought conditions that have persisted in recent years. Since no comprehensive study has been conducted to date on the effects of PM on liver, kidney, and coagulation laboratory markers in patients with COPD, there is a clear need for such a study. By studying this research, it is possible to predict future problems in patients with COPD and prevent their consequences by adopting appropriate strategies.
Materials and Methods
In this study, after obtaining the necessary permits, information on COPD patients was obtained by referring to the medical records department, hospital information system (HIS), and reviewing patients’ files in educational hospitals affiliated with Abadan University of Medical Sciences (Ayatollah Taleghani Educational Hospital of Abadan, Shahid Beheshti Educational Hospital of Abadan, and Valiasr Educational Hospital of Khorramshahr). All 270 patients who met the inclusion and exclusion criteria during the study period (March 21, 2022–March 20, 2023) were included.
The Abadan Environment Department provided information on air pollutant levels, specifically PM10 and PM2.5, from March 21, 2022, to March 20, 2023. These data were used to investigate the correlation between PM levels and clinical and laboratory markers in patients with COPD. The inclusion criteria for patients with COPD who were admitted to the educational hospitals of Abadan University of Medical Sciences from March 21, 2022, to March 20, 2023, along with their laboratory and clinical information, were available. The exclusion criterion for this study was patients with incomplete clinical and laboratory information.
The data are organized by admission date, sex, age, type of disease, clinical and laboratory markers, and concentration of PM10 and PM2.5. Duplicate entries were removed, the information was entered into Excel, and the results were analyzed using SPSS software, version 25. The study investigates the relationship between PM and laboratory and clinical markers in patients with COPD who were admitted between March 21, 2022, and March 20, 2023.
The mass concentration of PM was measured using a Met One Beta Attenuation Meter (BAM-1020) (Hafkenscheid & Vonk). The air quality monitoring station was situated on the rooftop of the Abadan Environmental Protection Agency office, approximately 10 meters above ground level. Sampling was conducted hourly over 24 hours each day. The mean annual PM concentrations were collected from March 21, 2022, to March 20, 2023, to assess air quality during this timeframe. Additionally, meteorological parameters were obtained from the Iran Meteorological Organization (IRIMO) to analyze the relationship between these variables and PM concentrations. The meteorological station was located at Abadan International Airport.
Before data extraction, we conducted an a priori power calculation to ensure a sufficient sample size for detecting an association between PM exposure and biomarker levels. We assumed a small effect size (|r|=0.2), a 2-sided significance level of α=0.05, and a statistical power (1-β)=0.95, consistent with conventions in observational epidemiology. The required sample size under these assumptions was estimated to be approximately 262 participants. Our final sample included 270 eligible patients, exceeding the calculated requirement.
After data collection, all analyses were conducted using IBM SPSS Statistics for Windows, version 25.0 (IBM Corp., Armonk, NY, USA). Descriptive statistics were used to summarize the data: qualitative variables were expressed as frequencies and percentages, and quantitative variables were reported as Mean±SD. The assumption of normality for quantitative variables was evaluated using the Kolmogorov-Smirnov test. Categorical variables were compared using the chi-square test or Fisher exact test when appropriate. Differences in means between two groups were assessed with independent-samples t-tests, while comparisons across more than two groups were performed using one-way analysis of variance (ANOVA). To examine the relationship between ambient PM concentrations (PM10 and PM2.5) and clinical and laboratory variables, multiple linear regression analyses were performed. Two modeling strategies were applied: a full model including all candidate predictors using the Enter method, and a reduced model obtained by excluding variables with evidence of severe multicollinearity and applying the Stepwise method. In all regression models, unstandardized coefficients (B), standard errors (SE), and P values were reported. Model assumptions were checked by examining variance inflation factors (VIF) to assess multicollinearity (with all final VIF values <2) and by using the Durbin–Watson statistic to confirm independence of residuals. All statistical tests were 2-sided, and P<0.05 were considered statistically significant.
Results
In this study, 270 patients with COPD were examined. Of these, 184(68.15%) were male, and 86(31.85%) were female, with a higher frequency among males.
The mean age of the patients with COPD was 63.97±12.96 years. The mean systolic blood pressure in these patients is 119.5±15.37 mm Hg, and the mean diastolic blood pressure is 77.61±10.24 mm Hg. The blood sugar (BS) level was 148.16±83.04 (mg/dL), which was higher than the normal mean. The mean of blood urea nitrogen (BUN) was reported as 22.99±13.99 (mg/dL), which is higher than the normal mean, and the mean of alkaline phosphatase (ALP) was 249.49±67.21 (mg/dL), which is higher than the normal level. The mean prothrombin time (PT) was 14.18±4.64 (s), which is higher than the normal. The mean of erythrocyte sedimentation rate (ESR) 34.47±24.22 (mm/h) in this study was higher than the normal mean. The mean pCO2 was also higher than normal (49.68±14.68). The HCO3 mean (28.6±6.38) is also higher than the normal. The mean SpO2 value is reported to be 90.19±8.28, which is lower than the normal mean. The number of breaths per minute was higher than normal (21.91±2.69). Shortness of breath was commonly observed in patients. Also, C-reactive protein (CRP) was +19%, ++26%, +++13% (Table 1).
In Table 2, we report statistical associations between PM10 concentrations and laboratory/clinical markers in COPD patients.
In model 1 (enter method), none of the predictors were significantly associated with PM10 levels. In model 2 (stepwise method, collinearity-adjusted), only arterial oxygen saturation (SpO2) approached significance, where each 1% increase in SpO2 was associated with an average increase of 2.10 µg/m³ in PM10 (P=0.063). Although not statistically significant at the 0.05 threshold, this result suggests a possible positive correlation between higher SpO2 and PM10 levels. Higher values of systolic pressure, BUN, and ESR tended to co-occur with higher PM10 levels; specifically, each 1-unit increase in systolic pressure, BUN, and ESR was associated with mean increases of 0.8 µg/m³, 1.57 µg/m³, and 1.17 µg/m³ in PM10, respectively. However, none of these associations reached statistical significance. Other clinical and laboratory parameters showed no significant relationship with PM10 (Table 2).
In Table 3, in model 1 (enter method), significant associations were observed for blood sugar, alanine transaminase (ALT), and ESR.
Specifically, each 1 mg/dL increase in BS was associated with a 0.17 µg/m³ higher PM2.5 concentration (P=0.001). ALT was inversely associated with PM2.5, where each 1 U/L increase in ALT corresponded to a 0.78 µg/m³ lower PM2.5 (P=0.016). ESR was positively associated with PM2.5, with each 1 mm/h increase in ESR corresponding to a 0.40 µg/m³ higher PM2.5 (P=0.039). In model 2 (stepwise method), these associations remained robust: BS was again positively associated with PM2.5 (B=0.15, P<0.001), ESR remained positively associated (B=0.53, P=0.002), and ALT retained its negative association (B=–0.78, P=0.016). Additionally, respiratory rate (RR) emerged as significant, with each one-unit increase in RR associated with a 2.25 µg/m³ lower PM2.5 concentration (P=0.041).
Discussion
In the present study, 270 patients with COPD were examined in educational hospitals of Abadan University of Medical Sciences. Shortness of breath was the most common symptom in these patients.
Among the laboratory markers of blood sugar, PT, BUN, and ALP were higher than the normal mean. ESR and CRP values were higher than normal. The mean pCO2 was also higher than normal, indicating respiratory acidosis, and the mean HCO3 was also higher than the normal mean, indicating metabolic alkalosis. Also, SpO2 has been reported as 90, which is lower than the normal mean.
No significant changes in laboratory or clinical markers were observed with increasing PM10 levels in COPD patients. For each unit increase in PM2.5, significant changes in blood sugar, BUN, ALT, and ESR were observed.
A study by Zhang J et al. showed that BUN levels were elevated in subjects with COPD [8]. Additionally, Giri et al. demonstrated that BUN levels were high in people with COPD, and these high levels were associated with an increased risk of mortality in COPD patients [9]. Furthermore, Du et al. reported that high BUN levels (above 40) were associated with longer hospital stays in patients with COPD [10]. In our study, the BUN level was higher than the normal mean.
According to a study by Tang et al., long-term exposure to PM10 is associated with a higher incidence of hyperuricemia and increased creatinine [11]. A 2025 meta-analysis by Li et al. found that long-term exposure to PM2.5 is associated with increased serum creatinine (SCr) and uric acid (UA). In contrast, short-term exposure to PM2.5 is associated with decreased estimated glomerular filtration rate (eGFR) and increased BUN [12]. Furthermore, in our study, we observed a significant increase in BUN for each unit rise in PM2.5.
Peng et al. discovered that exposure to PM2.5 can affect renal function by activating oxidative stress pathways [13]. Oxidative stress and inflammatory responses can accelerate the breakdown of structural proteins and amino acids, thereby increasing BUN production [14].
Wang L et al.’s study showed that serum ESR levels can predict the severity of COPD in elderly patients. In individuals with COPD, ESR levels were found to be higher than the normal mean [15]. In our study, we also found that the ESR levels were higher than the normal mean. Dehe et al indicated that individuals with COPD had lower SpO2 levels than the normal mean [16]. Our study findings support this conclusion.
Yang et al.’s study shows that levels of AST and D-dimer in people with COPD are higher than the normal mean [17]. In our study, the AST level was within the normal range. A study by Wang et al. found that long-term exposure to PM2.5 was associated with increased AST levels [18]. In our study, we did not observe significant changes in AST levels with increasing PM exposure.
Zhang et al. found that long-term exposure to PM2.5 is associated with higher ALT and AST levels [19]. Similarly, Kim et al. demonstrated that an increase in PM concentration is associated with a 2.3% increase in ALT and a 3% increase in AST [20]. Our study also found a significant increase in ALT with each unit rise in PM2.5.
Direct effects of PM on hepatocytes include induction of oxidative stress, DNA strand breaks, alterations in lipid metabolism, and promotion of a pro-inflammatory milieu [21]. In a study by Choi et al., low ALT levels are found to be a risk factor for the development of COPD. The study suggests that individuals with low ALT should be screened for COPD [22]. Additionally, Lasman et al found that ALT levels are low in people with COPD [23]. However, in our study, ALT levels were normal.
Bermudez et al. revealed that individuals with COPD have elevated blood sugar levels [24]. In our research, we observed higher-than-normal mean blood sugar levels. Bo et al.’s 2021 study demonstrated that lower PM2.5 levels are associated with lower blood sugar, while higher levels are associated with higher blood sugar [25]. Lee et al. found that exposure to PM2.5 was linked to an increased risk of diabetes and higher blood sugar levels [26]. Shen et al. study demonstrated that exposure to PM2.5 particles exceeding 5 μg/m3 is associated with elevated FBS levels and an increased risk of diabetes [27]. In our research, for each unit increase in PM2.5, we observed a significant increase in blood sugar.
Oxidative stress is recognized as a risk factor for metabolic syndrome and is also a consequence of exposure to air pollution. This condition provides a plausible explanation for the observed connections between air pollution and diabetes [28].
Due to the absence of a control group in the current study, it is suggested that case-control studies with large sample sizes be conducted to compare laboratory, liver, kidney, etc. indicators in patients with COPD. To compare these Indicators, the independent risk factors affecting the death of this patient group should also be identified. Also, future research should involve a larger sample size and encompass a broader range of locations. Furthermore, the impact of other air pollutants should be explored.
Conclusion
In patients with COPD, some renal, hepatic, and inflammatory laboratory markers were abnormal. A significant association was identified between PM and several of these laboratory markers, including blood sugar, ALT, and ESR. However, further extensive studies are necessary to explore this area more thoroughly. Implementing air pollution control strategies is crucial for the health of these patients, and it is essential to provide appropriate care for COPD patients on days with high pollution levels.
Study limitations
This study has several limitations, including its retrospective design, which may have introduced selection bias due to reliance on hospital records. In addition, important confounding variables such as smoking habits, comorbidities, medication use, and duration or severity of COPD were not available in the medical records. They were not controlled for in the analysis. These factors could have influenced the observed associations between PM exposure and laboratory markers.
Ethical Considerations
Compliance with ethical guidelines
This study was approved by the Research Ethics Committee of Abadan University of Medical Sciences, Abadan, Iran (Code: IR.ABADANUMS.REC.1401.132).
Funding
This research did not receive any grant from funding agencies in the public, commercial, or non-profit sectors.
Authors contributions
Conceptualization and project administration: Esmat Radmanesh; Data curation: Mohammad Amin Nosrati, Esmat Radmanesh, and Heydar Maleki; Formal analysis: Naser Kamyari; Writing the original draft: Esmat Radmanesh, Mohammad Amin Nosrati, and Naser Kamyari; Methodology, investigation, review and editing: All authors.
Conflict of interest
The authors declared no conflict of interest.
Acknowledgements
The authors gratefully acknowledge the Abadan Environmental Protection Department, the Khuzestan Environmental Department, the Iran Meteorological Organization (IRIMO), the Clinical Research Development Unit of Taleghani Educational Hospital, the Clinical Research Development Unit of Valiasr Educational Hospital, and Shahid Beheshti Educational Hospital of Abadan University of Medical Sciences.
References
- Christenson SA, Smith BM, Bafadhel M, Putcha N. Chronic obstructive pulmonary disease. Lancet. 2022; 399(10342):2227-42. [DOI:10.1016/S0140-6736(22)00470-6] [PMID]
- Guo P, Li R, Piao TH, Wang CL, Wu XL, Cai HY. Pathological mechanism and targeted drugs of COPD. International Journal of Chronic Obstructive Pulmonary Disease. 2022; 17:1565-75. [DOI:10.2147/COPD.S366126] [PMID]
- Yang IA, Jenkins CR, Salvi SS. Chronic obstructive pulmonary disease in never-smokers: Risk factors, pathogenesis, and implications for prevention and treatment. Lancet Respiratory Medicine. 2022; 10(5):497-511. [DOI:10.1016/S2213-2600(21)00506-3] [PMID]
- Wang K, Shen D, Dai P, Li C. Particulate matter in poultry house on poultry respiratory disease: A systematic review. Poultry Science. 2023; 102(4):102556. [DOI:10.1016/j.psj.2023.102556] [PMID]
- Bodor K, Szép R, Bodor Z. The human health risk assessment of particulate air pollution (PM2.5 and PM10) in Romania. Toxicology Reports. 2022; 9:556-62. [DOI:10.1016/j.toxrep.2022.03.022] [PMID]
- Sin DD, Doiron D, Agusti A, Anzueto A, Barnes PJ, Celli BR, et al. Air pollution and COPD: GOLD 2023 committee report. European Respiratory Journal. 2023; 61(5):2202469. [DOI:10.1183/13993003.02469-2022] [PMID]
- Khaefi M, Geravandi S, Hassani G, Yari AR, Soltani F, Dobaradaran S, et al. Association of particulate matter impact on prevalence of chronic obstructive pulmonary disease in Ahvaz, southwest Iran during 2009-2013. Aerosol and Air Quality Research. 2017; 17(1):230-7. [DOI:10.4209/aaqr.2015.11.0628]
- Zhang J, Qin Y, Zhou C, Luo Y, Wei H, Ge H, et al. Elevated BUN upon admission as a predictor of in-hospital mortality among patients with acute exacerbation of COPD: A secondary analysis of multicenter cohort study. International Journal of Chronic Obstructive Pulmonary Disease. 2023; 18:1445-55. [DOI:10.2147/COPD.S412106] [PMID]
- Giri M, He L, Hu T, Puri A, Zheng X, Dai H, et al. Blood urea nitrogen is associated with in-hospital mortality in critically ill patients with acute exacerbation of chronic obstructive pulmonary disease: A propensity score matching analysis. Journal of Clinical Medicine. 2022; 11(22):6709. [DOI:10.3390/jcm11226709] [PMID]
- Du J, Niu J, Ma L, Sui Y, Wang S. Association between blood urea nitrogen levels and length of stay in patients with pneumonic chronic obstructive pulmonary disease exacerbation: A secondary analysis based on a multicentre retrospective cohort study. International Journal of Chronic Obstructive Pulmonary Disease. 2022; 17:2847-56. [DOI:10.2147/COPD.S381872] [PMID]
- Tang YX, Bloom MS, Qian ZM, Liu E, Jansson DR, Vaughn MG, et al. Association between ambient air pollution and hyperuricemia in traffic police officers in China: A cohort study. International Journal of Environmental Health Research. 2021; 31(1):54-62. [DOI:10.1080/09603123.2019.1628926] [PMID]
- Li R, Wang K, Li M, Liu H, You Y, Liu D, et al. Association between ambient air pollution and renal function indicators: A comprehensive systematic review and meta-analysis. Environmental Research. 2025; 286(Pt 2):122841. [DOI:10.1016/j.envres.2025.122841] [PMID]
- Peng S, Lu T, Liu Y, Li Z, Liu F, Sun J, et al. Short-term exposure to fine particulate matter and its constituents may affect renal function via oxidative stress: A longitudinal panel study. Chemosphere. 2022; 293:133570. [DOI:10.1016/j.chemosphere.2022.133570] [PMID]
- Macedo E. Blood urea nitrogen beyond estimation of renal function. Critical Care Medicine. 2011; 39:405-6. [DOI:10.1097/CCM.0b013e318205c33a] [PMID]
- Wang L, Yang H, Gu W. Value of erythrocyte sedimentation rate and serum EPO levels in evaluating the condition and prognosis of COPD in the elderly. Pakistan Journal of Pharmaceutical Sciences. 2021; 34(1 Suppl):435-39. [PMID]
- Dehe L, Hohendanner F, Gültekin E, Werth G, Wutzler A, Bender TO. Hypoxia altitude simulation and reduction of cerebral oxygenation in COPD patients. Aerospace Medicine and Human Performance. 2023; 94(3):102-6. [DOI:10.3357/AMHP.6102.2023] [PMID]
- Yang C, Tuo Y, Shi X, Duo J, Liu X, Zhang F, et al. Prevalence, risk factors, and clinical characteristics of pulmonary embolism in patients with acute exacerbation of COPD in plateau regions: A prospective cohort study. BMC Pulmonary Medicine. 2024; 24(1):102. [DOI:10.1186/s12890-024-02915-z] [PMID]
- Wang H, Peng X, Cao F, Wang Y, Shi H, Lin S, et al. Cardiotoxicity and mechanism of particulate matter 2.5 (PM2.5) exposure in offspring rats during pregnancy. Medical Science Monitor. 2017; 23:3890-96. [DOI:10.12659/MSM.903006] [PMID]
- Zhang Z, Hu S, Fan P, Li L, Feng S, Xiao H, et al. The roles of liver inflammation and the insulin signaling pathway in PM2.5 instillation-induced insulin resistance in Wistar rats. Disease Markers. 2021; 2021:2821673. [DOI:10.1155/2021/2821673] [PMID]
- Kim KN, Lee H, Kim JH, Jung K, Lim YH, Hong YC. Physical activity- and alcohol-dependent association between air pollution exposure and elevated liver enzyme levels: An elderly panel study. Journal of Preventive Medicine and Public Health. 2015; 48(3):151-69. [DOI:10.3961/jpmph.15.014] [PMID]
- Kim JW, Park S, Lim CW, Lee K, Kim B. The role of air pollutants in initiating liver disease. Toxicological Research. 2014; 30(2):65-70. [DOI:10.5487/TR.2014.30.2.065] [PMID]
- Choi YJ, Kwon DS, Kim T, Cho JH, Kim HJ, Byun MK, et al. Low alanine aminotransferase as a risk factor for chronic obstructive pulmonary disease in males. Scientific Reports. 2021; 11(1):14829. [DOI:10.1038/s41598-021-94385-0] [PMID]
- Lasman N, Shalom M, Turpashvili N, Goldhaber G, Lifshitz Y, Leibowitz E, et al. Baseline low ALT activity is associated with increased long-term mortality after COPD exacerbations. BMC Pulmonary Medicine. 2020; 20(1):133. [DOI:10.1186/s12890-020-1169-z] [PMID]
- Bermudez G, Jasul G Jr, David-Wang A, Jimeno C, Magallanes J, Macalalad-Josue AA. Association of metabolic syndrome with the severity of airflow obstruction in patients with chronic obstructive pulmonary disease. Journal of the ASEAN Federation of Endocrine Societies. 2018; 33(2):181-87. [DOI:10.15605/jafes.033.02.11] [PMID]
- Bo Y, Chang LY, Guo C, Lin C, Lau AKH, Tam T, et al. Associations of reduced ambient PM2.5 level with lower plasma glucose concentration and decreased risk of type 2 diabetes in adults: A longitudinal cohort study. American Journal of Epidemiology. 2021; 190(10):2148-57. [DOI:10.1093/aje/kwab159] [PMID]
- Lee M, Ohde S. PM2.5 and diabetes in the Japanese population. International Journal of Environmental Research and Public Health. 2021; 18(12):6653. [DOI:10.3390/ijerph18126653] [PMID]
- Shen Y, Jiang L, Xie X, Meng X, Xu X, Dong J, et al. Long-term exposure to fine particulate matter and fasting blood glucose and diabetes in 20 million Chinese women of reproductive age. Diabetes Care. 2024; 47(8):1400-7. [DOI:10.2337/dc23-2153] [PMID]
- Lim CC, Thurston GD. Air pollution, oxidative stress, and diabetes: A life course epidemiologic perspective. Current Diabetes Reports. 2019; 19(8):58. [DOI:10.1007/s11892-019-1181-y] [PMID]
Type of Study: Original Article |
Subject:
Environmental Health
Send email to the article author
| Rights and permissions | |
 |
This work is licensed under a Creative Commons Attribution-NonCommercial 4.0 International License. |

This is an open access article distributed under the terms of the Creative Commons Attribution License (CC-By-NC), which permits use, distribution, and reproduction in any medium, provided the original work is properly cited and is not used for commercial purposes.
Contact Information
