Volume 14, Issue 2 (Spring 2026)
Iran J Health Sci 2026, 14(2): 137-152 |
Back to browse issues page



Ethics code: NHREC/01/01/2022-017
Clinical trials code: NA


Download citation:
BibTeX | RIS | EndNote | Medlars | ProCite | Reference Manager | RefWorks
Send citation to:


BibTeX | RIS | EndNote | Medlars | ProCite | Reference Manager | RefWorks
Send citation to:
Yaqoob A M, Salisu A, Ezie O. Income-related Inequalities and Inequities in Access to Inpatient Healthcare: A Decomposition Analysis Among Rural Households in Nigeria. Iran J Health Sci 2026; 14 (2) :137-152
URL: http://jhs.mazums.ac.ir/article-1-1115-en.html
URL: http://jhs.mazums.ac.ir/article-1-1115-en.html


Department of Economics and Development Studies, Faculty of Management and Social Sciences, Prime University Abuja, Abuja, Nigeria. , yaqoobmajeed042@gmail.com
Keywords: Health status disparities, Hospitalization, Public sector, Health services accessibility and concentration index (CI)
Full-Text [PDF 1208 kb]
(246 Downloads)
| Abstract (HTML) (999 Views)
Inequality and horizontal inequity in access to healthcare
The Erreygers-corrected concentration index (CI) estimates revealed significant income-related inequalities in access to healthcare. Access to primary (CI=−0.1054; 95% CI, −0.1818, −0.029) and secondary healthcare (CI=−0.1063, 95% CI, −0.2047, −0.0079) was pro-poor, as indicated by the negative values and confidence intervals that did not include zero. In contrast, access to tertiary healthcare (CI=0.2382; 95% CI, 0.1645, 0.3119) and private general healthcare (CI=0.1502; 95% CI, 0.0585, 0.2419) was pro-rich, with positive and statistically significant indices (Table 2).
The concentration curves (Figure 7, 8, 9, and 10) corroborated these findings, lying above the line of equality for primary and secondary healthcare (indicating pro-poor distribution) and below the line of equality for tertiary and private general healthcare (indicating pro-rich distribution).
References
Full-Text: (85 Views)
Introduction
One of the major challenges facing the global healthcare system today is inequity in access to health services. Public health authorities in most countries aim to achieve equity in healthcare, ensuring that all individuals can attain quality healthcare regardless of socioeconomic circumstances [1–3]. This principle is embedded in the concept of universal health coverage (UHC), which emphasizes the right to essential healthcare without financial hardship and was first articulated in the 1978 Alma-Ata declaration [4, 5]. Sustainable development goal 3 further emphasizes equitable access to quality healthcare for all populations [2, 6].
In this context, inequality in healthcare refers to observable differences in access or utilization of healthcare between individuals or population groups, while inequity refers to unfair or avoidable differences arising from social, economic, or geographic disadvantages [7]. For example, two individuals with similar health needs may receive different levels of care due to their income, education, or place of residence.
Global evidence shows that disparities in healthcare utilization are widespread across population groups, regions, and countries, with low- and middle-income countries experiencing the greatest challenges [8, 9]. In Nigeria, wealthier individuals and urban residents typically enjoy greater access to quality healthcare than poorer or rural populations [10–12]. These disparities undermine overall population health, contributing to poor health outcomes at the national level. Nigeria continues to face a high burden of both communicable and non-communicable diseases (NCDs) [13]. For instance, maternal mortality remains alarmingly high: the lifetime risk for a Nigerian woman during her reproductive years is 1 in 22, compared to 1 in 180 in low-income countries and 1 in 4900 in high-income countries [14]. Similarly, child mortality is disproportionately higher among rural populations due to longer travel distances to health facilities, limited transportation options, inadequate health resources, and lower education levels [15]. Geographic disparities are also notable with maternal mortality rates in the Northeast and Northwest geopolitical zones being 10 and 4 times higher, respectively, than those in the Southwest [16, 17]. For NCD-related deaths, Nigeria accounts for approximately 30% of all deaths in sub-Saharan Africa, with a 22% risk of premature death from cardiovascular diseases, cancers, respiratory diseases, and diabetes among adults aged 30–69 years [18]. Between 2010 and 2019, disability-adjusted life years lost to NCDs increased by 21.3%, compared to 6.5% for infectious diseases [19], suggesting an ongoing epidemiological transition. Most of these deaths are linked to preventable risk factors, such as aging, unhealthy diet, obesity, hypertension, and diabetes, underscoring the critical need for accessible preventive and screening services [20]. Healthcare financing in Nigeria is heavily reliant on out-of-pocket (OOP) payments, which disproportionately affect poor rural households earning less than 1.9 USD per day, limiting their access to care and exacerbating poverty [21, 22].
Nigeria operates a three-tier healthcare system—primary, secondary, and tertiary—managed at local, state, and federal levels through a referral system [23]. Primary care serves as the first point of contact, secondary care provides specialized services at local/regional hospitals, and tertiary care delivers advanced treatment in teaching hospitals and specialized units [24]. Despite these efforts, Nigeria ranked 142 out of 195 countries in health system performance, indicating persistent gaps in access and equity [25].
Past studies on inequalities in healthcare utilization have largely focused on countries in South Asia and Latin America, where differences in socioeconomic characteristics often drive disparities in service use. For example, Xu et al. [26] found evidence of pro-rich inequality in the utilization of health services using post-healthcare-reform longitudinal data. Their findings also indicate that need factors contributed more than 50% to inequality in health service use among rural residents, while socioeconomic status, education level, and employment status accounted for the largest share among non-need factors. Similarly, Garcia-Ramirez et al. [27] reported that wealth quintile and type of health insurance made the largest contributions to inequality in the utilization of preventive health services. Using data from China, Zhang et al. [28] found that income, health status (including chronic conditions), and age significantly contributed to inequalities in inpatient healthcare utilization, particularly among older populations.
In Nigeria, however, most empirical studies on healthcare inequalities have focused primarily on maternal and child health services, with limited attention to inequalities across broader healthcare settings [14, 29, 30]. While these studies provide valuable insights into disparities affecting maternal and child healthcare utilization, they offer limited evidence on inequalities in inpatient healthcare utilization, which typically reflects more severe health conditions and requires greater financial and institutional resources. Understanding disparities in inpatient care is particularly important because hospitalization often involves higher costs, specialized medical personnel, and advanced medical technologies, making access more sensitive to socioeconomic differences. Despite its importance, empirical evidence on income-related inequalities in inpatient healthcare utilization in Nigeria—particularly in rural areas—remains scarce. Therefore, this study investigates income-related inequalities and inequities in access to inpatient healthcare among households in rural Nigeria, to provide evidence to inform policies to reduce disparities across the healthcare system. The rest of the paper is organized as follows: Section 2 discusses sample size, design, and data collection. Section 3 presents the main results, while section 4 presents the discussion. Section 5 dwells on the conclusion and policy recommendations.
Materials and Methods
Setting
The survey was conducted in rural Nigeria between May and October 2022. At the time of independence, Nigeria’s rural population was estimated at 38,110,994 people, accounting for approximately 85% of the total population, the highest share of the rural population in the country’s demographic history. Since then, this proportion has steadily declined—from 84.59% in 1960 to 48.04% in 2020, and further to 45.72% in 2023. Over the post-independence period, the average rural population share was estimated at 64.55%, and this historical average was used to determine the sample size in this study [31].
Sample size and design
The sample size for this study was determined using standard survey sampling procedures, following Cochran’s formula [32] and the International Fund for Agricultural Development (IFAD) survey guidelines, as presented in Equation 1. In the formula, z represents the confidence level set at 98% (2.33), m denotes the margin of error (4.5% or 0.045), and refers to the estimated proportion of rural households in the sample (65%). Using these parameters, the calculated sample size was 610 households. After accounting for design effects and contingency adjustments, the final sample size was increased to 624 households. Of the distributed questionnaires, 505 valid responses were retained for analysis, representing an 81% response rate. The remaining questionnaires were excluded due to incomplete information and inconsistencies. To address potential nonresponse bias, an inverse probability weighting approach was applied. Response probabilities were estimated using logistic regression, and the inverse of these probabilities was multiplied by the design sampling weights to produce adjusted weights. To prevent excessive influence from extreme weights, values above the 99th percentile were trimmed, thereby stabilizing the combined weights. The use of a 98% confidence level and a margin of error of 0.045 follows the IFAD methodological guidelines to achieve greater statistical precision. These stricter thresholds enhance confidence in the estimated parameters, reduce the likelihood of misleading conclusions, and provide narrower uncertainty bounds [33, 34].
where n=the sample size; other parameters are as previously defined.
A multistage sampling procedure was used to draw a sample of 624 rural households. In the first stage, three of Nigeria’s six geopolitical zones were randomly selected. The selected geopolitical zones include Southeast, Southwest, and Northeast Nigeria. The second stage involved randomly selecting two states from each zone. The selected states include Imo and Ebonyi from the Southeast; Oyo and Ekiti from the Southwest; and Taraba and Bornu from the Northeast. In the third stage, two rural local government areas (LGAs) were randomly selected from each of the six states. In the fourth stage, two wards were randomly selected from each of the LGAs, making a total of twenty-four wards. The last stage involved a random selection of twenty-six (26) households from each of the wards resulting in a total of six hundred and twenty-four (624) households.
Data collection
Primary data for this study were collected using a semi-structured questionnaire administered through an oral interview. Enumerators were carefully recruited and trained to conduct the interviews and administer the questionnaire. Before the survey commenced, participants were informed of the study’s objectives and assured that the information they provided would be used strictly for research purposes, with full anonymity and confidentiality maintained. Participants were also informed of their right to withdraw from the survey at any stage without consequence. Verbal informed consent was obtained from all individuals who agreed to participate in this study. Responses were obtained from the household head or any adult household member (aged >18 years) who had adequate knowledge of the household’s circumstances and could provide reliable responses to the survey questions.
The questionnaire consisted of two main sections: the first section collected information on household demographic and socioeconomic characteristics, including age, gender, household size, marital status, education level, primary occupation, source of income, total household expenditure, and wealth, the second section focused on health and healthcare-related information, such as the type of healthcare provider visited, the nature of illnesses experienced, OOP healthcare expenditure, average waiting time, perceived quality of healthcare, operating hours of health facilities, and households’ subjective assessment of healthcare accessibility, measured using ten items.
Description of variables
Outcome variable
The outcome variable of interest was access to healthcare, measured on a binary scale. In this study, access is defined as both the opportunity to use healthcare and its actual utilization, consistent with established definitions in the health services literature [35]. Data on healthcare utilization were primarily based on inpatient care, defined as any use of inpatient health services in the three months preceding the survey, regardless of length of hospital stay. The types of healthcare included public and private providers. Public healthcare providers are formal facilities owned by the government, offering inpatient and outpatient preventive, curative, and restorative services, and are categorized into primary (dispensaries and maternity centers), secondary (state or general hospitals), and tertiary (teaching or specialist hospitals) facilities [36]. Private healthcare providers are formal facilities owned by individuals or organizations, recognized under the country’s regulatory and legal framework, providing inpatient and outpatient preventive, curative, and restorative services [37]. Access to primary healthcare was coded as a binary variable, taking the value 1 if the household head or any household member had used a public primary healthcare facility in the three months prior to the survey, and 0 otherwise. Similarly, access to secondary healthcare was coded as 1 if any household member had used a state or general hospital and 0 otherwise. In contrast, access to tertiary healthcare was coded as 1 if any household member had used a teaching or specialist hospital and 0 otherwise. Access to private healthcare was coded as 1 if any household member had utilized a private facility during the same period, and 0 otherwise.
Need variables
Need variables refer to the health condition as it may be perceived or evaluated by the individual or household, necessitating a visit and use of medical services [38]. We use age, sex, and the respondent’s self-reported health condition, assigning a value of 1 if the household head or any household member reported a chronic health condition (defined as any of the illnesses captured in the study except skin problems) and 0 otherwise. These included reproductive illness, polio, asthma, hepatitis, eye/ear infection, acute headache, hypertension, stroke, arthritis, diabetes, skin problems, and malaria. Age is a categorical variable taking the value 1 if the household head is below 30 years, 2 if aged 30-59 years, and 3 if aged 60 or above. Sex is a binary variable taking the value 1 if the household head is male and 0 otherwise.
Non-need variables
Other control variables considered as non-need variables in the study include educational level, marital status, employment type, region of residence, and economic status. Educational level is a categorical variable taking the value 1 if the respondent has at most primary education, 2 if the respondent completed secondary education, and 3 if the respondent has completed tertiary education. Marital status is a binary variable, taking the value 1 if the respondent is married and 0 otherwise. Employment type is also binary, coded 1 if the respondent’s primary occupation is farming and 0 otherwise. Region of residence was initially coded as 1 for respondents residing in the North East, 2 for the South East, and 3 for the South West. For ease of analysis based on the North/South geographical divide, this variable was re-coded into a binary variable using the appropriate sample weights, taking a value of 1 if the respondent resided in the North and 0 otherwise. Household economic status was measured using per capita total household expenditure, classified into five quintiles. Per capita household consumption expenditure was adopted because self-reported income, particularly among rural households in Africa and other developing countries, is often unreliable due to under-reporting and seasonal fluctuations [39].
Statistical analysis
Following Shen et al. [40], income-related inequality in healthcare utilization was measured using the Erreygers-corrected Concentration Index (ECI) and its decomposition. The ECI was employed due to the binary nature of the healthcare outcome, as the standard concentration index is inappropriate for bounded variables [41]. The Erreygers index is a normalized version of the standard concentration index, specifically designed for bounded health variables, such as binary outcomes [41]. Following Erreygers [41], the ECI is given as:
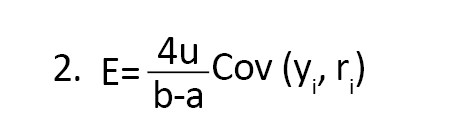
Where yi denotes healthcare utilization for individual i, μ is the mean of y, ri is the fractional rank of individuals in the income distribution (proxied by per capita consumption expenditure), and a and b represent the lower and upper bounds of y, respectively. For binary variables (a=0, b=1), the index simplifies to E=4μ. The value of the Erreygers index ranges between −1 and +1. A negative (positive) value indicates that healthcare utilization is disproportionately concentrated among the poor (rich), while a value of zero implies equality across socioeconomic groups [42]. To account for differences in healthcare needs, a measure of horizontal inequity (HI) was estimated following Wagstaff et. al. [41] and Van Doorslaer et al. [42], but adapted to the Erreygers framework. HI measures inequity by comparing observed healthcare utilization with need-predicted utilization. It is expressed as:
3. HI=CE-CnE
Where HI is the HI index; CE is the observed Erreygers concentration index and CEN is the Erreygers index of need-predicted healthcare utilization.
Need-standardized utilization was obtained by controlling for need variables (e.g. age, sex, and health condition), ensuring that any remaining inequality reflects inequity due to non-need factors. A positive (negative) HI indicates pro-rich (pro-poor) inequity in healthcare utilization after adjusting for differences in need.
Decomposition of the concentration index
The ECI was decomposed to quantify the contribution of each explanatory variable to income-related inequality in healthcare utilization, as well as the unexplained residual component [41, 43, 44]. Erreygers normalization is appropriate for bounded health variables, particularly binary outcomes, as it corrects for the limitations of the standard concentration index [41]. The decomposition was implemented using a one-step estimation approach in Stata, which simultaneously estimates marginal effects, the concentration index of each explanatory variable, and their respective contributions to overall inequality. This approach ensures internal consistency in estimating all decomposition components. Healthcare utilization was modeled as a function of a set of explanatory variables:
4. yi=α +∑k βk Xki+εi
Where yi is a binary indicator of healthcare utilization for individual i, Xki represents explanatory variables (comprising need and non-need factors), βk are the marginal effects, and εi is the error term.
Based on the Erreygers decomposition framework, the overall inequality can be expressed as:
5. CE=∑kβkx̄kCk + GCε
Where CE is the Erreygers concentration index, x̄k is the mean of explanatory variable k, Ck is the concentration index of Ck, and GCε is the generalized concentration index of the error term.
The contribution of each explanatory variable to overall inequality is given by ∑kβkx̄kCk, while the percentage contribution is obtained by dividing each contribution by the total concentration index (CE). The residual term (GCε) captures the portion of inequality that cannot be explained by observed covariates, reflecting unobserved heterogeneity and model limitations. For analytical clarity, explanatory variables were grouped into need factors (e.g. age, sex, and health condition) and non-need factors (e.g. socioeconomic status, education, and region of residence), enabling the assessment of their relative contributions to inequality. All analyses were conducted using Stata version 17, employing appropriate routines for Erreygers decomposition.
Results
Descriptive statistics and socio-economic patterns of healthcare access
The descriptive statistics of the respondents, as presented in Table 1, showed that the majority were male (89.7%) and married (88.7%).
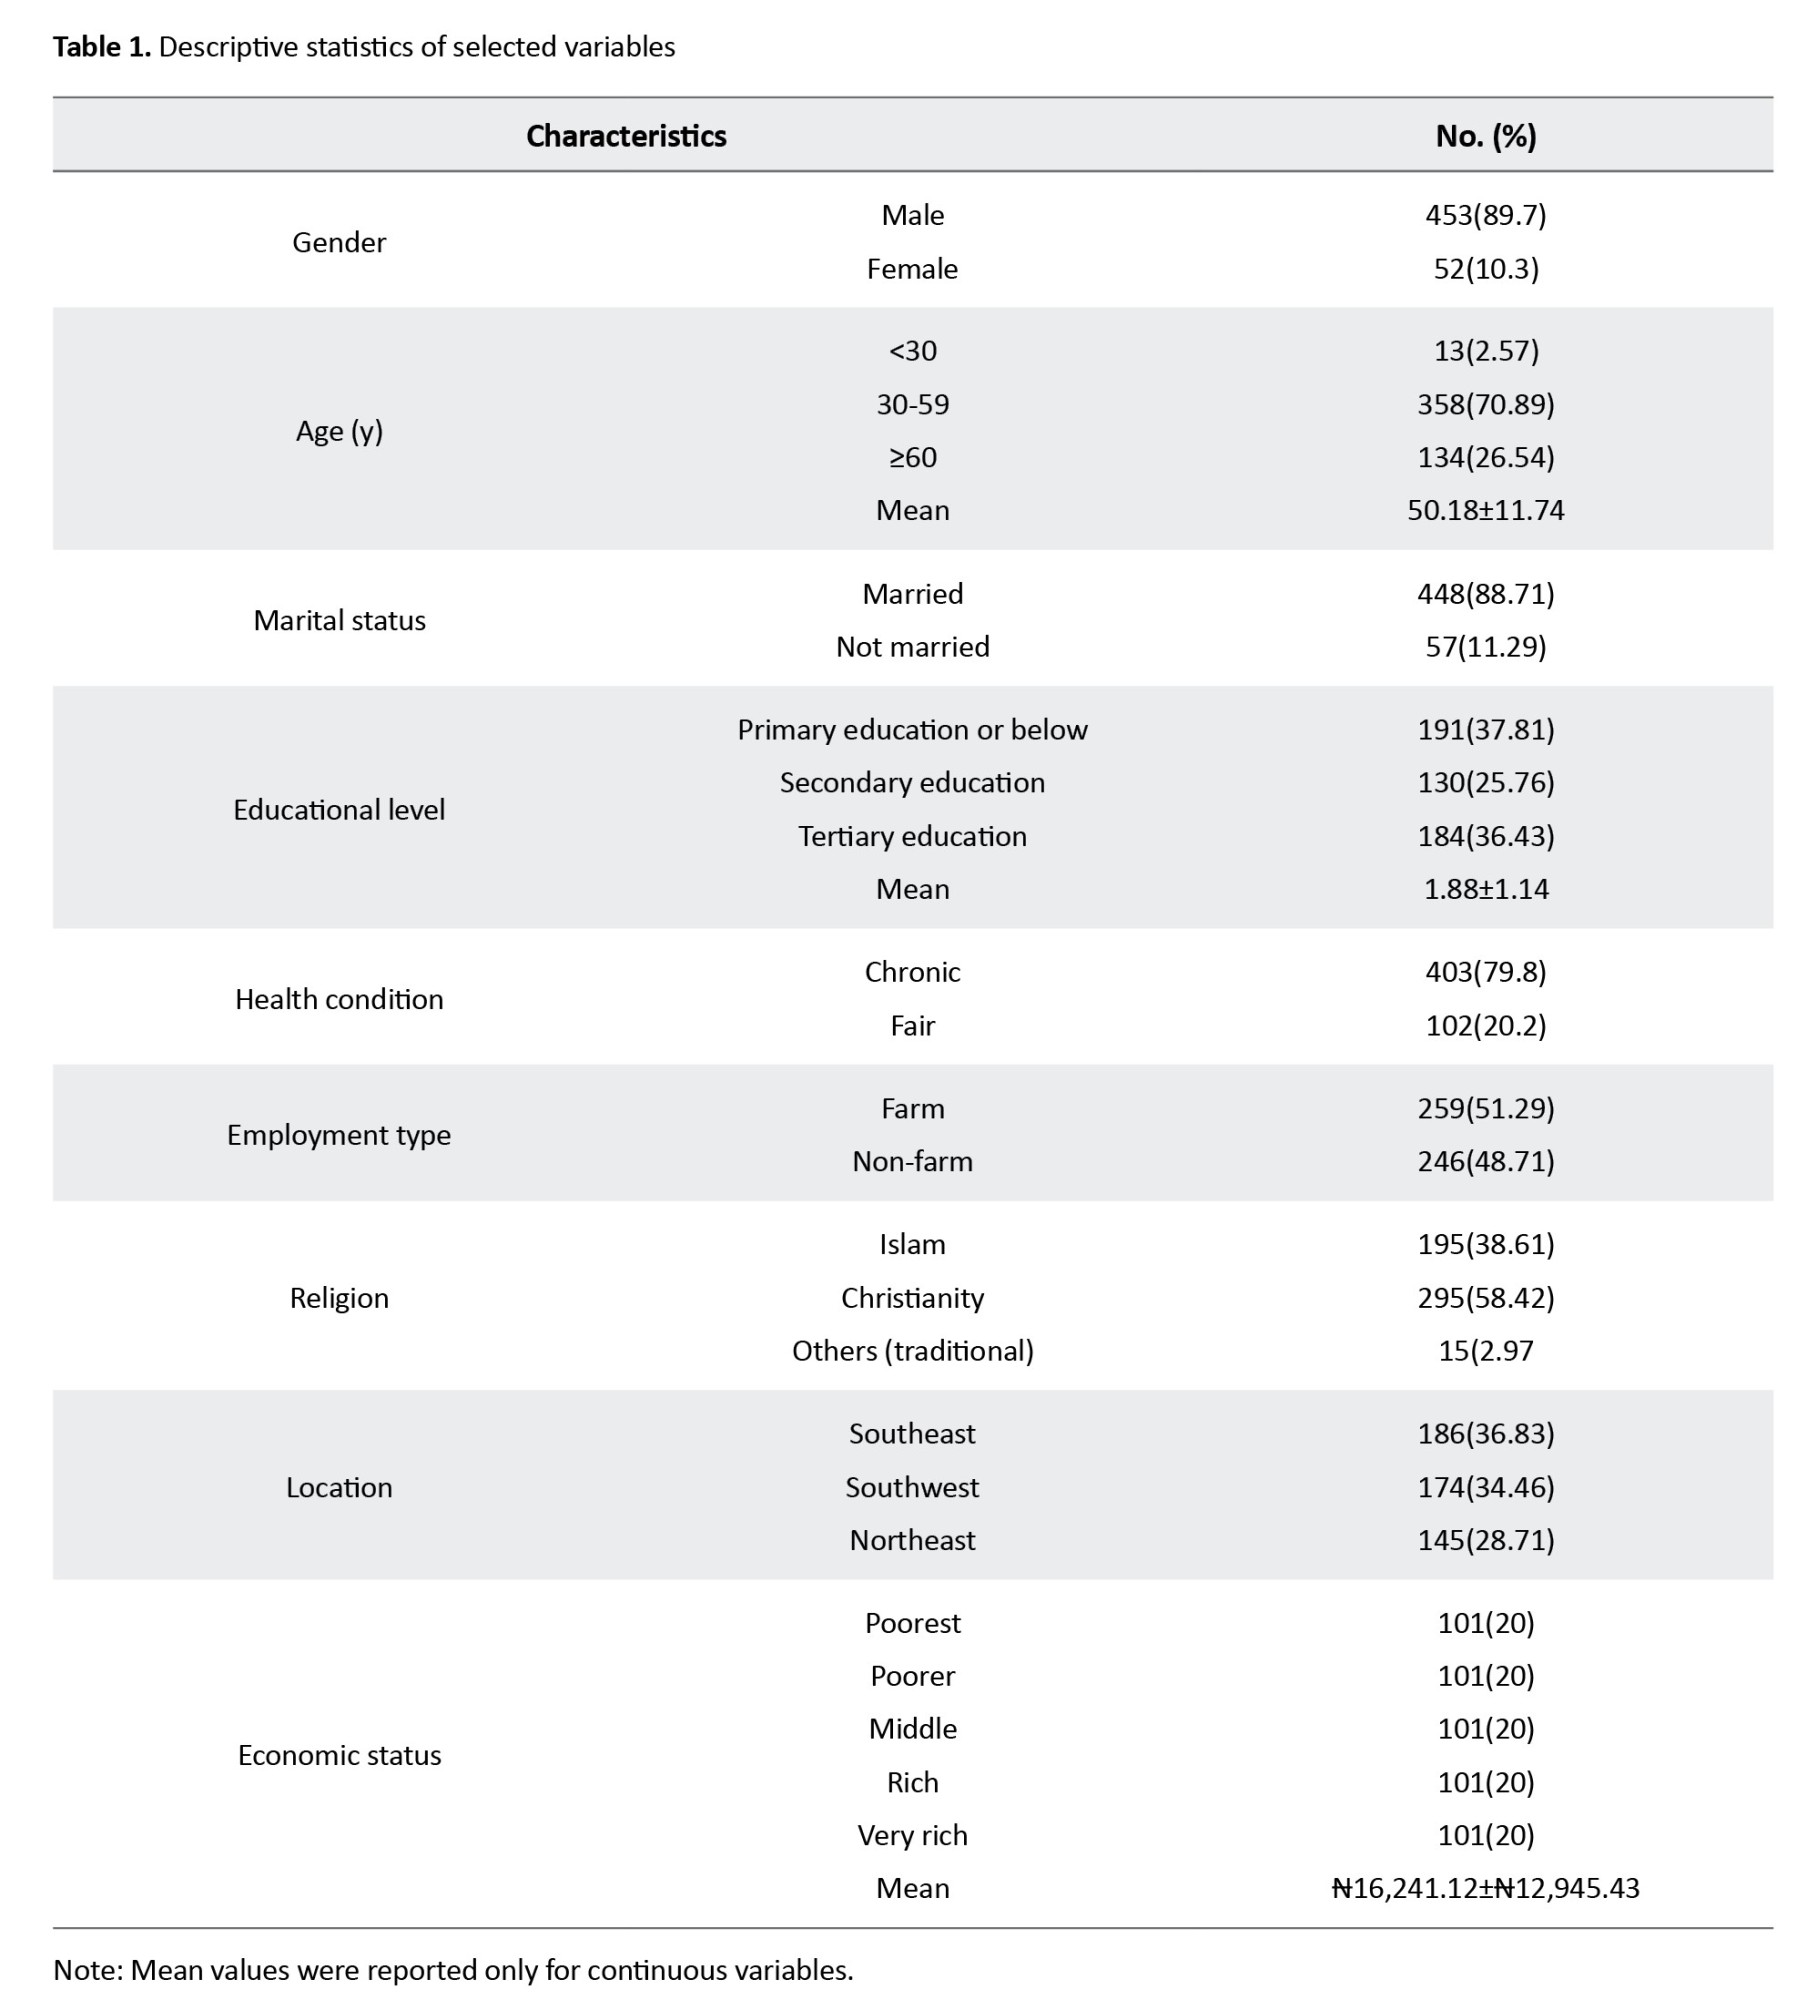
Most respondents were aged 30–59 years (70.9%), with a mean age of 50.2±11.7 years, indicating that most were in the active labour force. However, this also suggested a potential decline in labour productivity due to rural–urban youth migration.
Regarding education, 37.8% had at most primary-level education, while the majority of respondents were primarily engaged in farming (51.3%). A substantial proportion (79.8%) reported having a chronic health condition. Regarding healthcare utilization, 81.4% accessed primary healthcare, 49.9% accessed secondary healthcare, 18.4% accessed tertiary healthcare, and 32.7% accessed private healthcare facilities (Figure 1).
One of the major challenges facing the global healthcare system today is inequity in access to health services. Public health authorities in most countries aim to achieve equity in healthcare, ensuring that all individuals can attain quality healthcare regardless of socioeconomic circumstances [1–3]. This principle is embedded in the concept of universal health coverage (UHC), which emphasizes the right to essential healthcare without financial hardship and was first articulated in the 1978 Alma-Ata declaration [4, 5]. Sustainable development goal 3 further emphasizes equitable access to quality healthcare for all populations [2, 6].
In this context, inequality in healthcare refers to observable differences in access or utilization of healthcare between individuals or population groups, while inequity refers to unfair or avoidable differences arising from social, economic, or geographic disadvantages [7]. For example, two individuals with similar health needs may receive different levels of care due to their income, education, or place of residence.
Global evidence shows that disparities in healthcare utilization are widespread across population groups, regions, and countries, with low- and middle-income countries experiencing the greatest challenges [8, 9]. In Nigeria, wealthier individuals and urban residents typically enjoy greater access to quality healthcare than poorer or rural populations [10–12]. These disparities undermine overall population health, contributing to poor health outcomes at the national level. Nigeria continues to face a high burden of both communicable and non-communicable diseases (NCDs) [13]. For instance, maternal mortality remains alarmingly high: the lifetime risk for a Nigerian woman during her reproductive years is 1 in 22, compared to 1 in 180 in low-income countries and 1 in 4900 in high-income countries [14]. Similarly, child mortality is disproportionately higher among rural populations due to longer travel distances to health facilities, limited transportation options, inadequate health resources, and lower education levels [15]. Geographic disparities are also notable with maternal mortality rates in the Northeast and Northwest geopolitical zones being 10 and 4 times higher, respectively, than those in the Southwest [16, 17]. For NCD-related deaths, Nigeria accounts for approximately 30% of all deaths in sub-Saharan Africa, with a 22% risk of premature death from cardiovascular diseases, cancers, respiratory diseases, and diabetes among adults aged 30–69 years [18]. Between 2010 and 2019, disability-adjusted life years lost to NCDs increased by 21.3%, compared to 6.5% for infectious diseases [19], suggesting an ongoing epidemiological transition. Most of these deaths are linked to preventable risk factors, such as aging, unhealthy diet, obesity, hypertension, and diabetes, underscoring the critical need for accessible preventive and screening services [20]. Healthcare financing in Nigeria is heavily reliant on out-of-pocket (OOP) payments, which disproportionately affect poor rural households earning less than 1.9 USD per day, limiting their access to care and exacerbating poverty [21, 22].
Nigeria operates a three-tier healthcare system—primary, secondary, and tertiary—managed at local, state, and federal levels through a referral system [23]. Primary care serves as the first point of contact, secondary care provides specialized services at local/regional hospitals, and tertiary care delivers advanced treatment in teaching hospitals and specialized units [24]. Despite these efforts, Nigeria ranked 142 out of 195 countries in health system performance, indicating persistent gaps in access and equity [25].
Past studies on inequalities in healthcare utilization have largely focused on countries in South Asia and Latin America, where differences in socioeconomic characteristics often drive disparities in service use. For example, Xu et al. [26] found evidence of pro-rich inequality in the utilization of health services using post-healthcare-reform longitudinal data. Their findings also indicate that need factors contributed more than 50% to inequality in health service use among rural residents, while socioeconomic status, education level, and employment status accounted for the largest share among non-need factors. Similarly, Garcia-Ramirez et al. [27] reported that wealth quintile and type of health insurance made the largest contributions to inequality in the utilization of preventive health services. Using data from China, Zhang et al. [28] found that income, health status (including chronic conditions), and age significantly contributed to inequalities in inpatient healthcare utilization, particularly among older populations.
In Nigeria, however, most empirical studies on healthcare inequalities have focused primarily on maternal and child health services, with limited attention to inequalities across broader healthcare settings [14, 29, 30]. While these studies provide valuable insights into disparities affecting maternal and child healthcare utilization, they offer limited evidence on inequalities in inpatient healthcare utilization, which typically reflects more severe health conditions and requires greater financial and institutional resources. Understanding disparities in inpatient care is particularly important because hospitalization often involves higher costs, specialized medical personnel, and advanced medical technologies, making access more sensitive to socioeconomic differences. Despite its importance, empirical evidence on income-related inequalities in inpatient healthcare utilization in Nigeria—particularly in rural areas—remains scarce. Therefore, this study investigates income-related inequalities and inequities in access to inpatient healthcare among households in rural Nigeria, to provide evidence to inform policies to reduce disparities across the healthcare system. The rest of the paper is organized as follows: Section 2 discusses sample size, design, and data collection. Section 3 presents the main results, while section 4 presents the discussion. Section 5 dwells on the conclusion and policy recommendations.
Materials and Methods
Setting
The survey was conducted in rural Nigeria between May and October 2022. At the time of independence, Nigeria’s rural population was estimated at 38,110,994 people, accounting for approximately 85% of the total population, the highest share of the rural population in the country’s demographic history. Since then, this proportion has steadily declined—from 84.59% in 1960 to 48.04% in 2020, and further to 45.72% in 2023. Over the post-independence period, the average rural population share was estimated at 64.55%, and this historical average was used to determine the sample size in this study [31].
Sample size and design
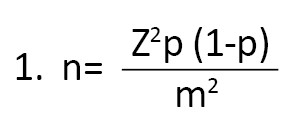
The sample size for this study was determined using standard survey sampling procedures, following Cochran’s formula [32] and the International Fund for Agricultural Development (IFAD) survey guidelines, as presented in Equation 1. In the formula, z represents the confidence level set at 98% (2.33), m denotes the margin of error (4.5% or 0.045), and refers to the estimated proportion of rural households in the sample (65%). Using these parameters, the calculated sample size was 610 households. After accounting for design effects and contingency adjustments, the final sample size was increased to 624 households. Of the distributed questionnaires, 505 valid responses were retained for analysis, representing an 81% response rate. The remaining questionnaires were excluded due to incomplete information and inconsistencies. To address potential nonresponse bias, an inverse probability weighting approach was applied. Response probabilities were estimated using logistic regression, and the inverse of these probabilities was multiplied by the design sampling weights to produce adjusted weights. To prevent excessive influence from extreme weights, values above the 99th percentile were trimmed, thereby stabilizing the combined weights. The use of a 98% confidence level and a margin of error of 0.045 follows the IFAD methodological guidelines to achieve greater statistical precision. These stricter thresholds enhance confidence in the estimated parameters, reduce the likelihood of misleading conclusions, and provide narrower uncertainty bounds [33, 34].
where n=the sample size; other parameters are as previously defined.
A multistage sampling procedure was used to draw a sample of 624 rural households. In the first stage, three of Nigeria’s six geopolitical zones were randomly selected. The selected geopolitical zones include Southeast, Southwest, and Northeast Nigeria. The second stage involved randomly selecting two states from each zone. The selected states include Imo and Ebonyi from the Southeast; Oyo and Ekiti from the Southwest; and Taraba and Bornu from the Northeast. In the third stage, two rural local government areas (LGAs) were randomly selected from each of the six states. In the fourth stage, two wards were randomly selected from each of the LGAs, making a total of twenty-four wards. The last stage involved a random selection of twenty-six (26) households from each of the wards resulting in a total of six hundred and twenty-four (624) households.
Data collection
Primary data for this study were collected using a semi-structured questionnaire administered through an oral interview. Enumerators were carefully recruited and trained to conduct the interviews and administer the questionnaire. Before the survey commenced, participants were informed of the study’s objectives and assured that the information they provided would be used strictly for research purposes, with full anonymity and confidentiality maintained. Participants were also informed of their right to withdraw from the survey at any stage without consequence. Verbal informed consent was obtained from all individuals who agreed to participate in this study. Responses were obtained from the household head or any adult household member (aged >18 years) who had adequate knowledge of the household’s circumstances and could provide reliable responses to the survey questions.
The questionnaire consisted of two main sections: the first section collected information on household demographic and socioeconomic characteristics, including age, gender, household size, marital status, education level, primary occupation, source of income, total household expenditure, and wealth, the second section focused on health and healthcare-related information, such as the type of healthcare provider visited, the nature of illnesses experienced, OOP healthcare expenditure, average waiting time, perceived quality of healthcare, operating hours of health facilities, and households’ subjective assessment of healthcare accessibility, measured using ten items.
Description of variables
Outcome variable
The outcome variable of interest was access to healthcare, measured on a binary scale. In this study, access is defined as both the opportunity to use healthcare and its actual utilization, consistent with established definitions in the health services literature [35]. Data on healthcare utilization were primarily based on inpatient care, defined as any use of inpatient health services in the three months preceding the survey, regardless of length of hospital stay. The types of healthcare included public and private providers. Public healthcare providers are formal facilities owned by the government, offering inpatient and outpatient preventive, curative, and restorative services, and are categorized into primary (dispensaries and maternity centers), secondary (state or general hospitals), and tertiary (teaching or specialist hospitals) facilities [36]. Private healthcare providers are formal facilities owned by individuals or organizations, recognized under the country’s regulatory and legal framework, providing inpatient and outpatient preventive, curative, and restorative services [37]. Access to primary healthcare was coded as a binary variable, taking the value 1 if the household head or any household member had used a public primary healthcare facility in the three months prior to the survey, and 0 otherwise. Similarly, access to secondary healthcare was coded as 1 if any household member had used a state or general hospital and 0 otherwise. In contrast, access to tertiary healthcare was coded as 1 if any household member had used a teaching or specialist hospital and 0 otherwise. Access to private healthcare was coded as 1 if any household member had utilized a private facility during the same period, and 0 otherwise.
Need variables
Need variables refer to the health condition as it may be perceived or evaluated by the individual or household, necessitating a visit and use of medical services [38]. We use age, sex, and the respondent’s self-reported health condition, assigning a value of 1 if the household head or any household member reported a chronic health condition (defined as any of the illnesses captured in the study except skin problems) and 0 otherwise. These included reproductive illness, polio, asthma, hepatitis, eye/ear infection, acute headache, hypertension, stroke, arthritis, diabetes, skin problems, and malaria. Age is a categorical variable taking the value 1 if the household head is below 30 years, 2 if aged 30-59 years, and 3 if aged 60 or above. Sex is a binary variable taking the value 1 if the household head is male and 0 otherwise.
Non-need variables
Other control variables considered as non-need variables in the study include educational level, marital status, employment type, region of residence, and economic status. Educational level is a categorical variable taking the value 1 if the respondent has at most primary education, 2 if the respondent completed secondary education, and 3 if the respondent has completed tertiary education. Marital status is a binary variable, taking the value 1 if the respondent is married and 0 otherwise. Employment type is also binary, coded 1 if the respondent’s primary occupation is farming and 0 otherwise. Region of residence was initially coded as 1 for respondents residing in the North East, 2 for the South East, and 3 for the South West. For ease of analysis based on the North/South geographical divide, this variable was re-coded into a binary variable using the appropriate sample weights, taking a value of 1 if the respondent resided in the North and 0 otherwise. Household economic status was measured using per capita total household expenditure, classified into five quintiles. Per capita household consumption expenditure was adopted because self-reported income, particularly among rural households in Africa and other developing countries, is often unreliable due to under-reporting and seasonal fluctuations [39].
Statistical analysis
Following Shen et al. [40], income-related inequality in healthcare utilization was measured using the Erreygers-corrected Concentration Index (ECI) and its decomposition. The ECI was employed due to the binary nature of the healthcare outcome, as the standard concentration index is inappropriate for bounded variables [41]. The Erreygers index is a normalized version of the standard concentration index, specifically designed for bounded health variables, such as binary outcomes [41]. Following Erreygers [41], the ECI is given as:
Where yi denotes healthcare utilization for individual i, μ is the mean of y, ri is the fractional rank of individuals in the income distribution (proxied by per capita consumption expenditure), and a and b represent the lower and upper bounds of y, respectively. For binary variables (a=0, b=1), the index simplifies to E=4μ. The value of the Erreygers index ranges between −1 and +1. A negative (positive) value indicates that healthcare utilization is disproportionately concentrated among the poor (rich), while a value of zero implies equality across socioeconomic groups [42]. To account for differences in healthcare needs, a measure of horizontal inequity (HI) was estimated following Wagstaff et. al. [41] and Van Doorslaer et al. [42], but adapted to the Erreygers framework. HI measures inequity by comparing observed healthcare utilization with need-predicted utilization. It is expressed as:
3. HI=CE-CnE
Where HI is the HI index; CE is the observed Erreygers concentration index and CEN is the Erreygers index of need-predicted healthcare utilization.
Need-standardized utilization was obtained by controlling for need variables (e.g. age, sex, and health condition), ensuring that any remaining inequality reflects inequity due to non-need factors. A positive (negative) HI indicates pro-rich (pro-poor) inequity in healthcare utilization after adjusting for differences in need.
Decomposition of the concentration index
The ECI was decomposed to quantify the contribution of each explanatory variable to income-related inequality in healthcare utilization, as well as the unexplained residual component [41, 43, 44]. Erreygers normalization is appropriate for bounded health variables, particularly binary outcomes, as it corrects for the limitations of the standard concentration index [41]. The decomposition was implemented using a one-step estimation approach in Stata, which simultaneously estimates marginal effects, the concentration index of each explanatory variable, and their respective contributions to overall inequality. This approach ensures internal consistency in estimating all decomposition components. Healthcare utilization was modeled as a function of a set of explanatory variables:
4. yi=α +∑k βk Xki+εi
Where yi is a binary indicator of healthcare utilization for individual i, Xki represents explanatory variables (comprising need and non-need factors), βk are the marginal effects, and εi is the error term.
Based on the Erreygers decomposition framework, the overall inequality can be expressed as:
5. CE=∑kβkx̄kCk + GCε
Where CE is the Erreygers concentration index, x̄k is the mean of explanatory variable k, Ck is the concentration index of Ck, and GCε is the generalized concentration index of the error term.
The contribution of each explanatory variable to overall inequality is given by ∑kβkx̄kCk, while the percentage contribution is obtained by dividing each contribution by the total concentration index (CE). The residual term (GCε) captures the portion of inequality that cannot be explained by observed covariates, reflecting unobserved heterogeneity and model limitations. For analytical clarity, explanatory variables were grouped into need factors (e.g. age, sex, and health condition) and non-need factors (e.g. socioeconomic status, education, and region of residence), enabling the assessment of their relative contributions to inequality. All analyses were conducted using Stata version 17, employing appropriate routines for Erreygers decomposition.
Results
Descriptive statistics and socio-economic patterns of healthcare access
The descriptive statistics of the respondents, as presented in Table 1, showed that the majority were male (89.7%) and married (88.7%).
Most respondents were aged 30–59 years (70.9%), with a mean age of 50.2±11.7 years, indicating that most were in the active labour force. However, this also suggested a potential decline in labour productivity due to rural–urban youth migration.
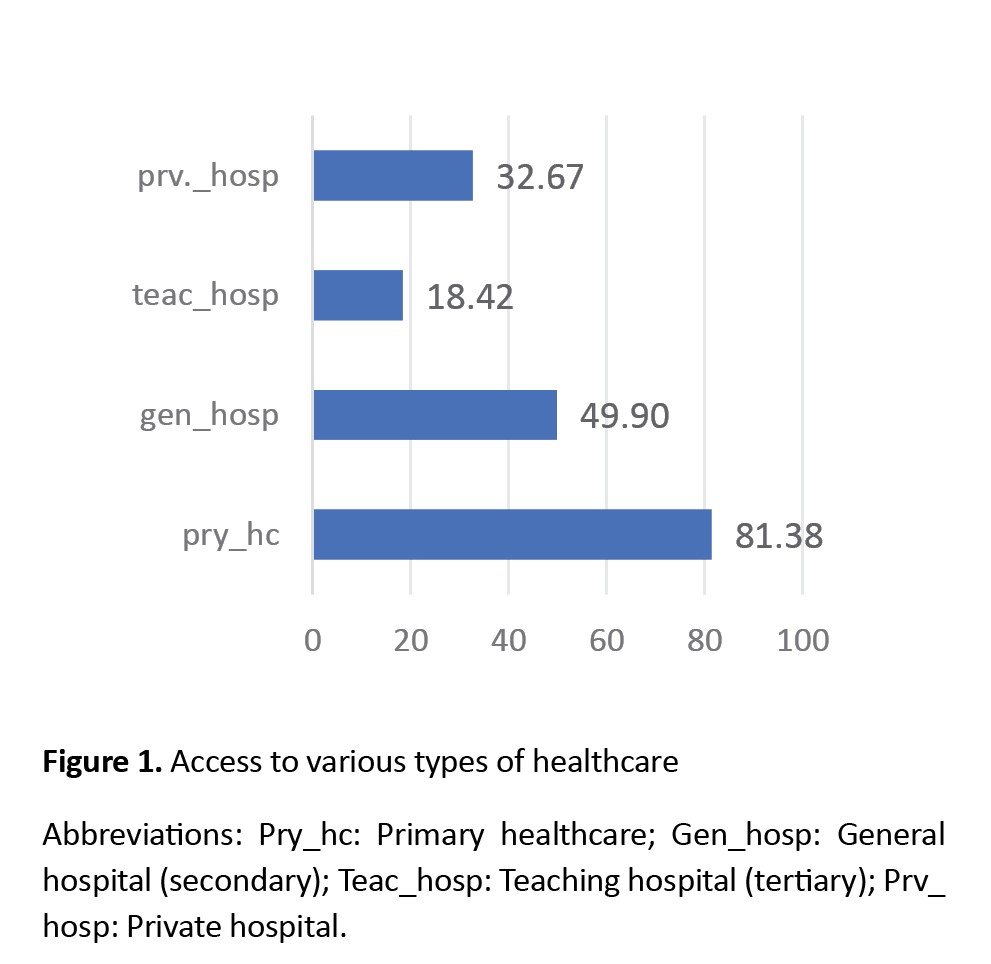
Regarding education, 37.8% had at most primary-level education, while the majority of respondents were primarily engaged in farming (51.3%). A substantial proportion (79.8%) reported having a chronic health condition. Regarding healthcare utilization, 81.4% accessed primary healthcare, 49.9% accessed secondary healthcare, 18.4% accessed tertiary healthcare, and 32.7% accessed private healthcare facilities (Figure 1).
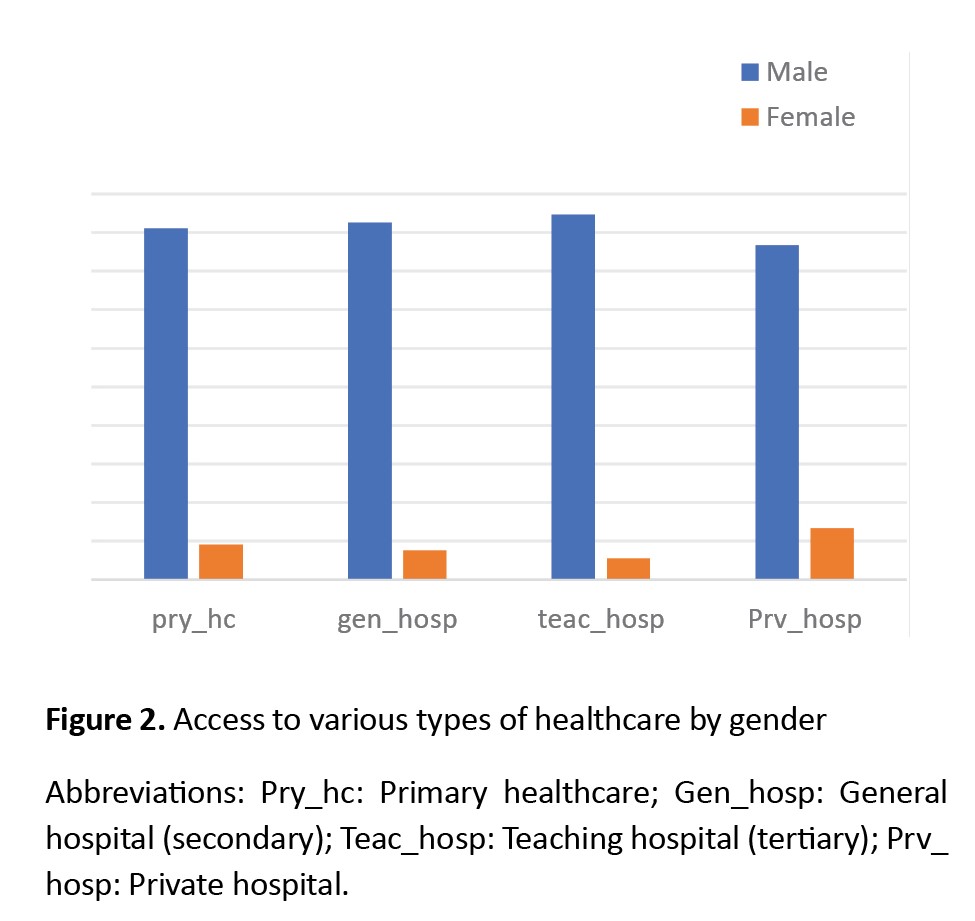
Regarding access to healthcare by gender, males had higher utilization across all healthcare types: public primary health care (PHC) 91%, secondary health care (SHC) 92.5%, tertiary health care (THC) 94.6%, and private general health care (GHC) 86.7%. In contrast, females reported lower access: PHC 9%, SHC 7.5%, THC 5.4%, and private GHC 13.3% (Figure 2).
The higher healthcare utilization observed among males may be influenced by a combination of occupational exposure, socioeconomic factors, and gender norms that allow males greater access to healthcare compared to females.”
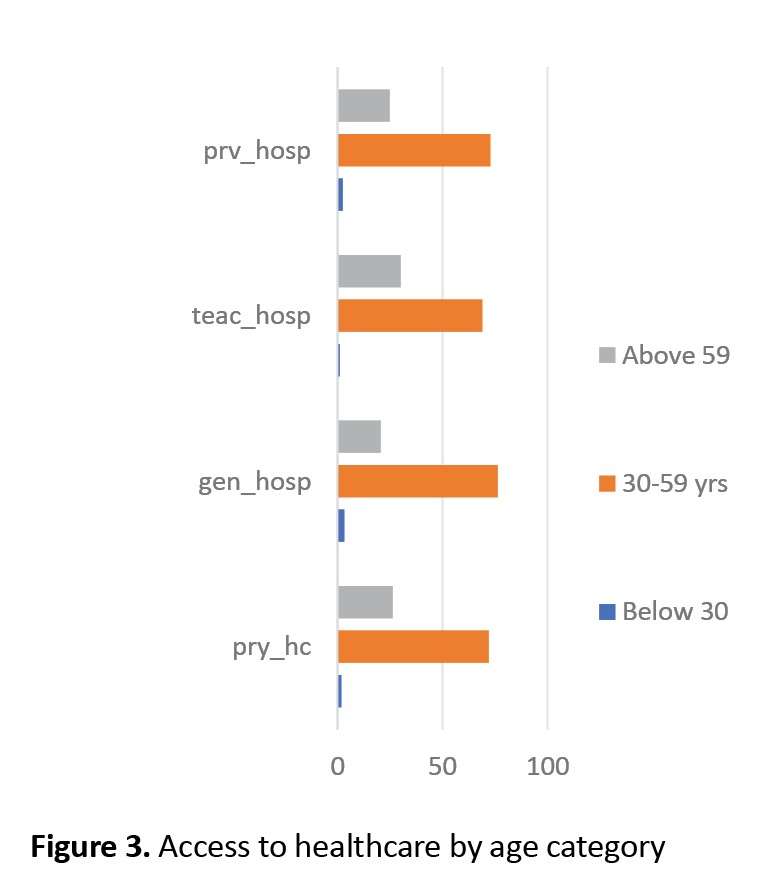
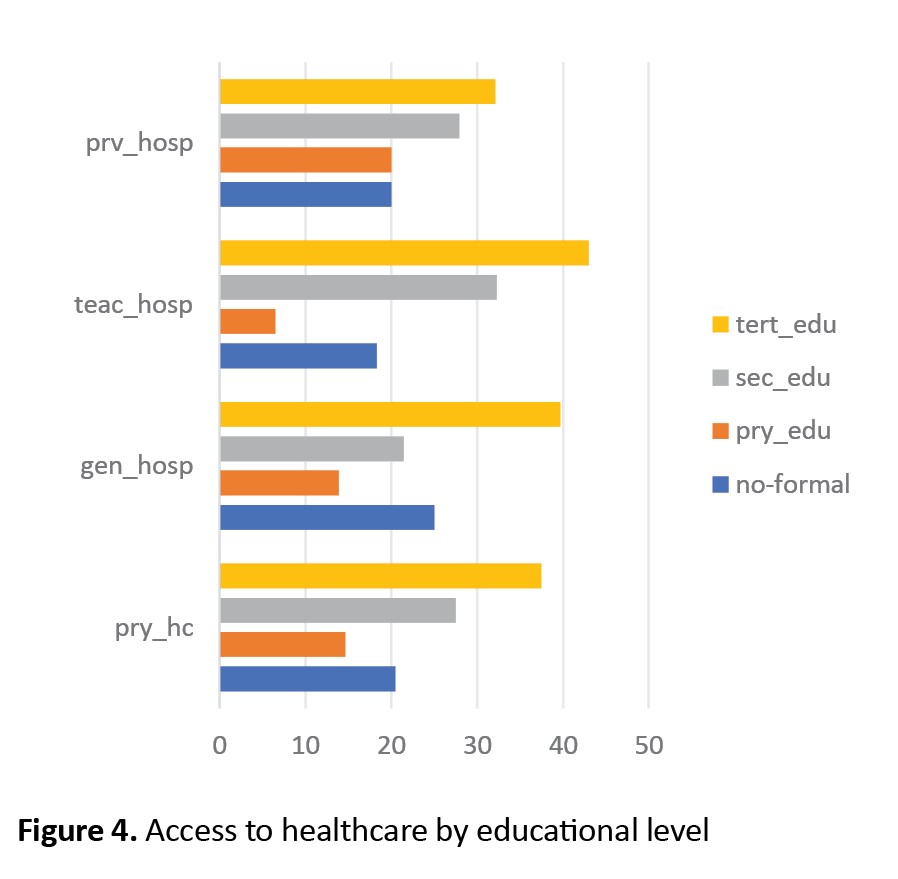
Age and education were associated with differences in healthcare access. Respondents aged 30–59 years had the highest utilization across all facility types (public PHC 72%, SHC 76.2%, THC 68.8%, private GHC 72.7%).
Those with tertiary education also reported the greatest access, while the least access was observed among respondents under 30 years and those with at most primary education (Figures 3 and 4).
Age and education were associated with differences in healthcare access. Respondents aged 30–59 years had the highest utilization across all facility types (public PHC 72%, SHC 76.2%, THC 68.8%, private GHC 72.7%).
Those with tertiary education also reported the greatest access, while the least access was observed among respondents under 30 years and those with at most primary education (Figures 3 and 4).
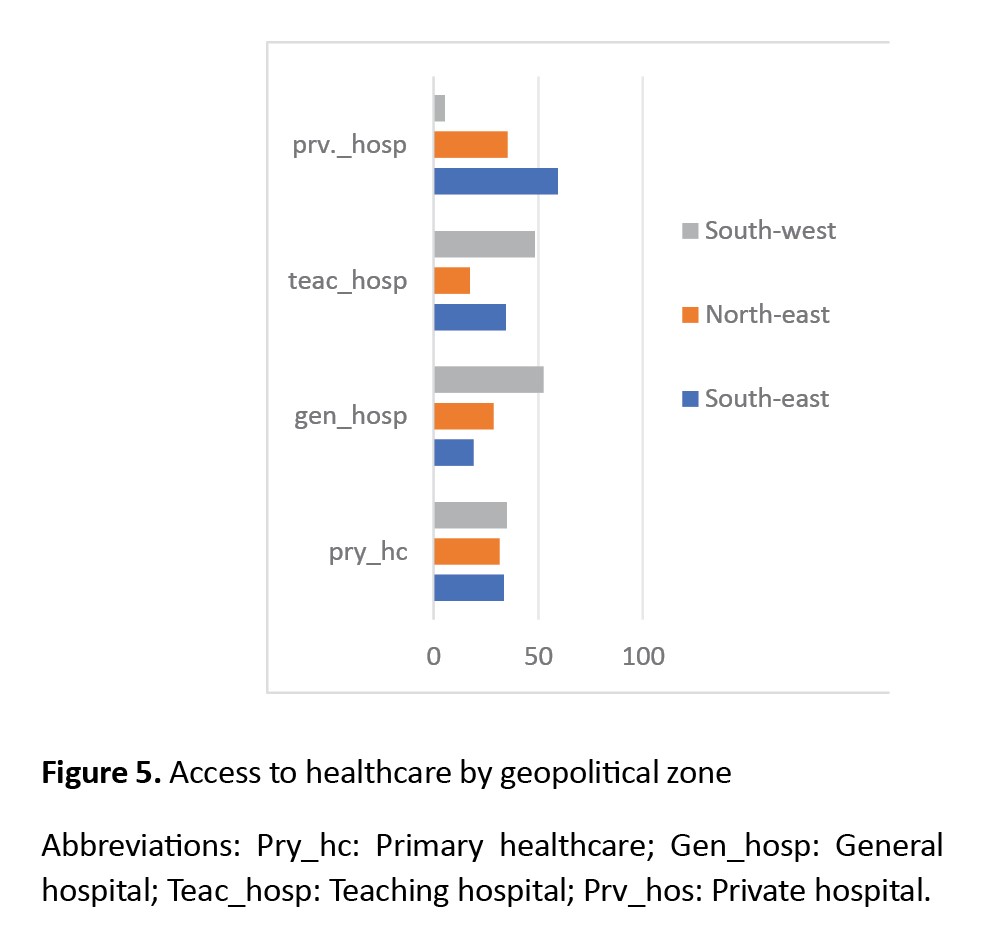
Regarding the geographical region, respondents in the southwest had the highest access to all types of public healthcare, whereas respondents in the southeast had the highest access only to private facilities. Overall, the northeast region was the most disadvantaged, with consistently low access across all healthcare types (Figure 5).
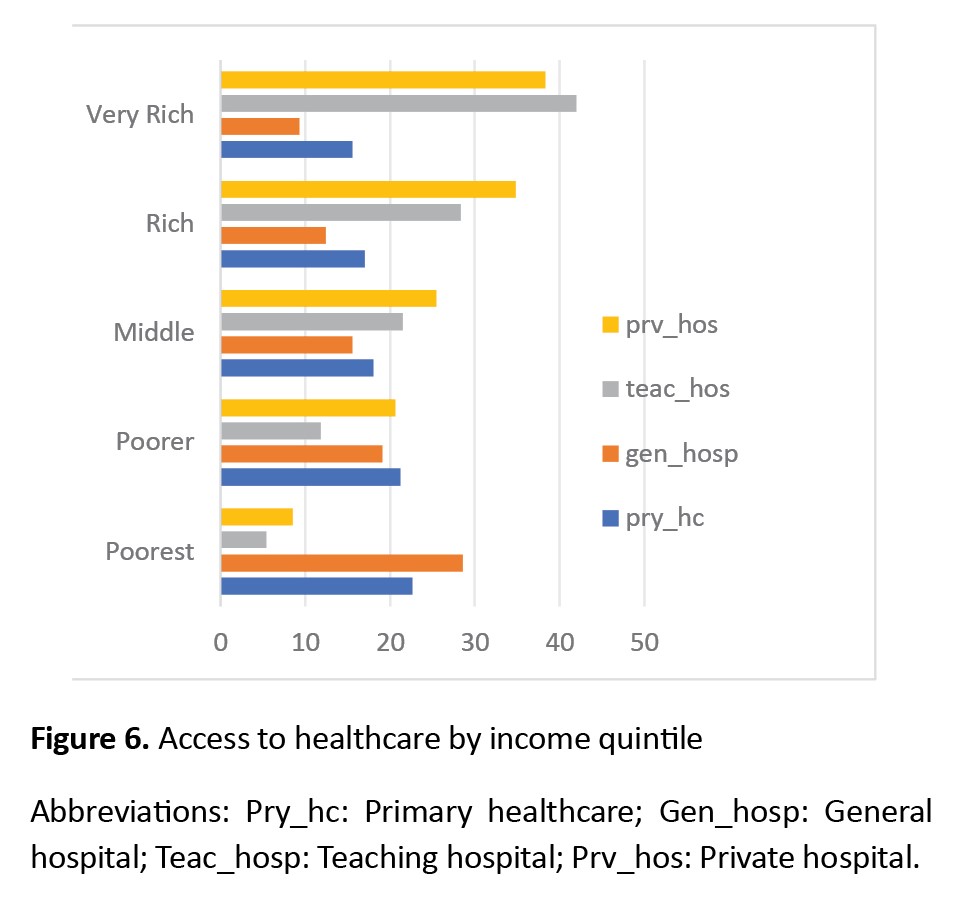
Economic status was also strongly correlated with access to healthcare. Access to public primary and secondary healthcare decreased with increasing wealth, indicating a pro-poor pattern. In contrast, access to public tertiary and private general healthcare increased with wealth, reflecting pro-rich inequality (Figure 6).
Inequality and horizontal inequity in access to healthcare
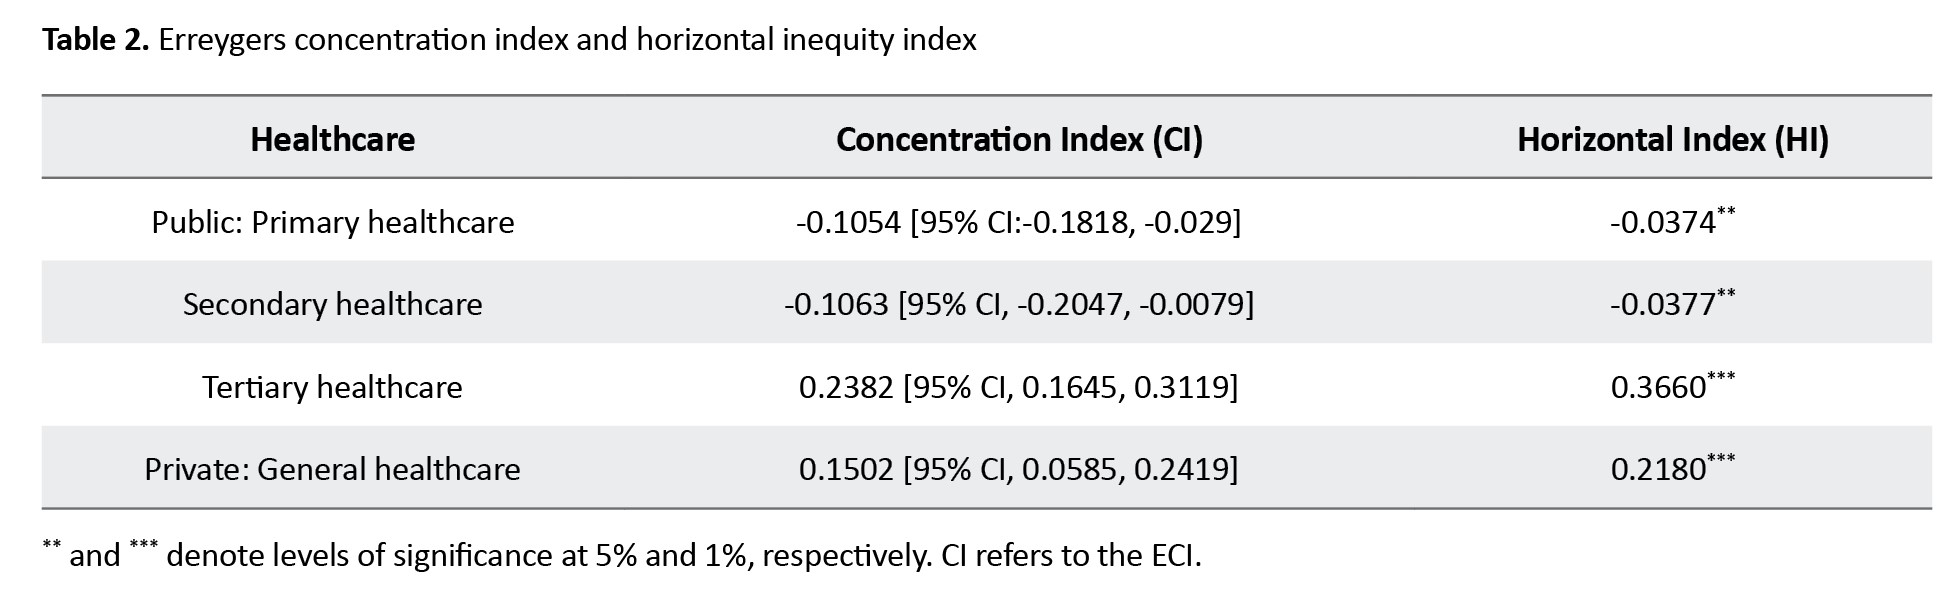
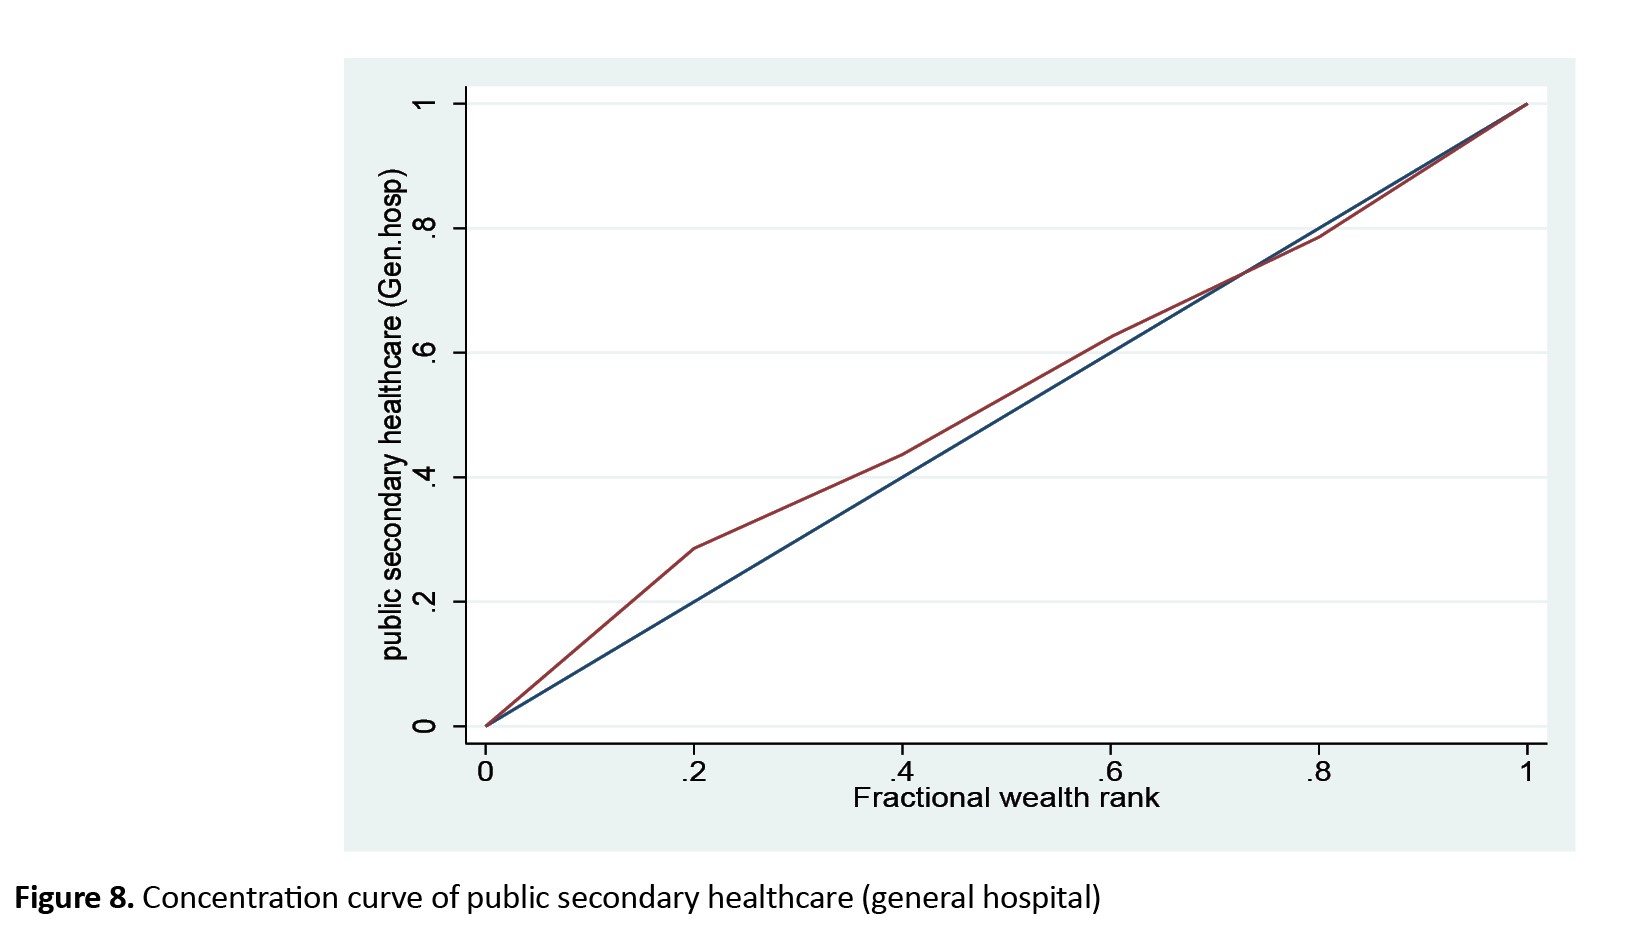
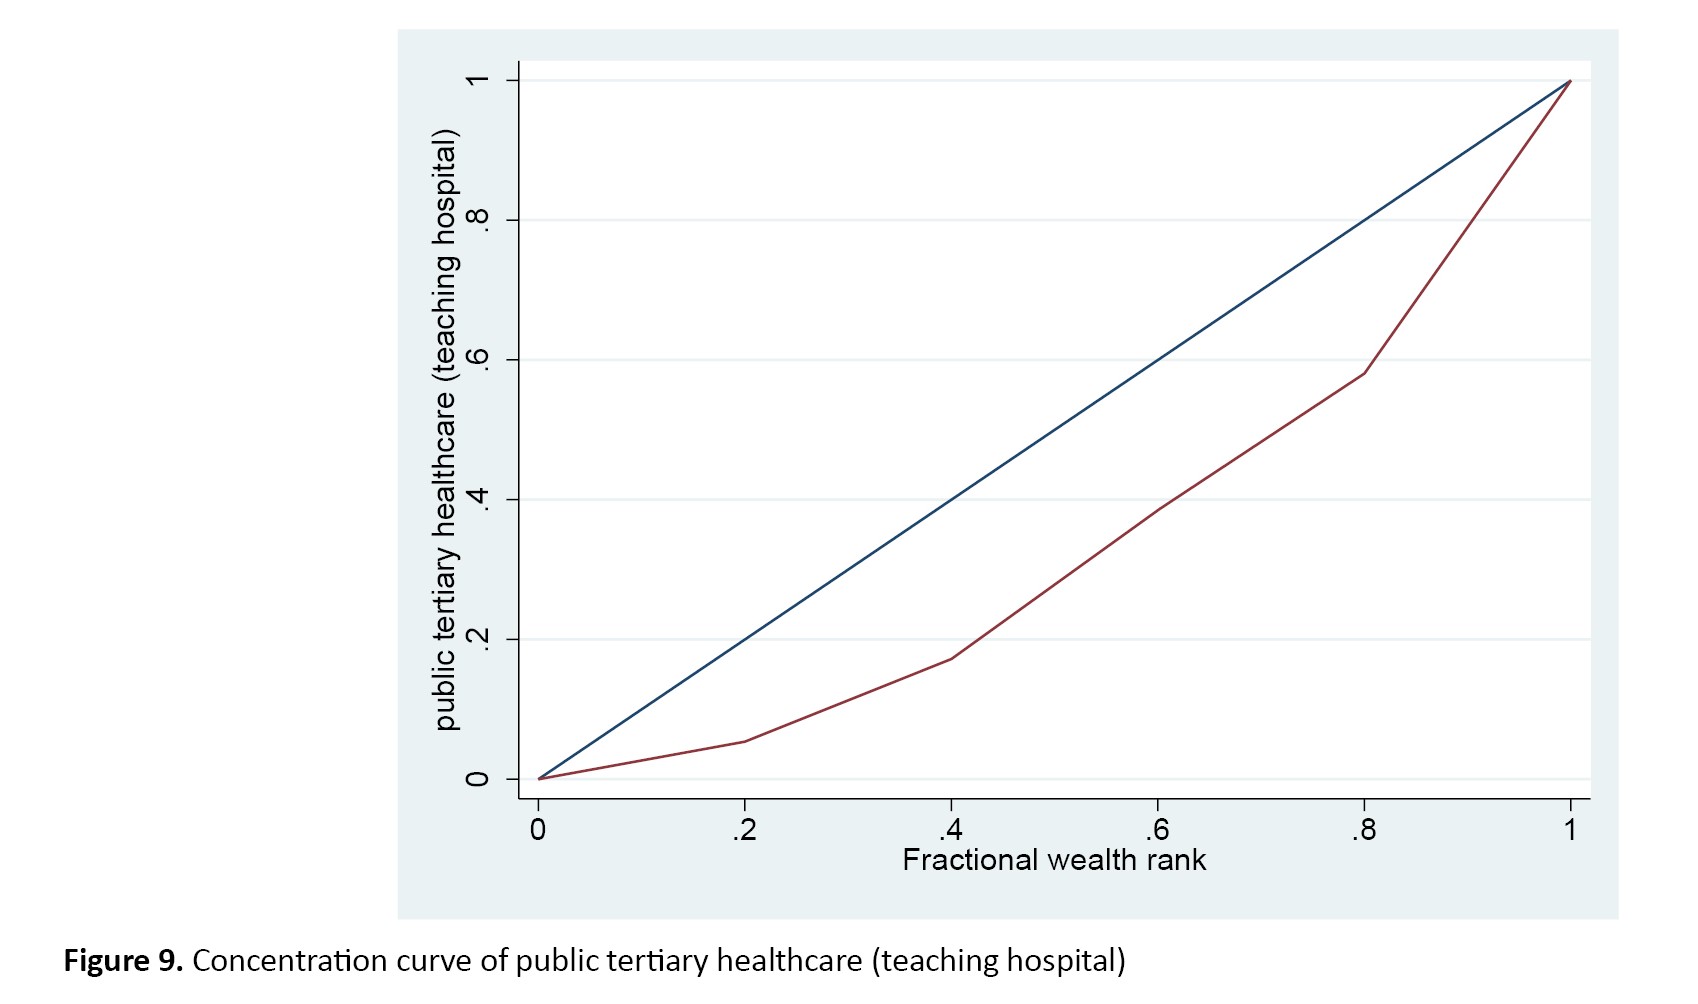
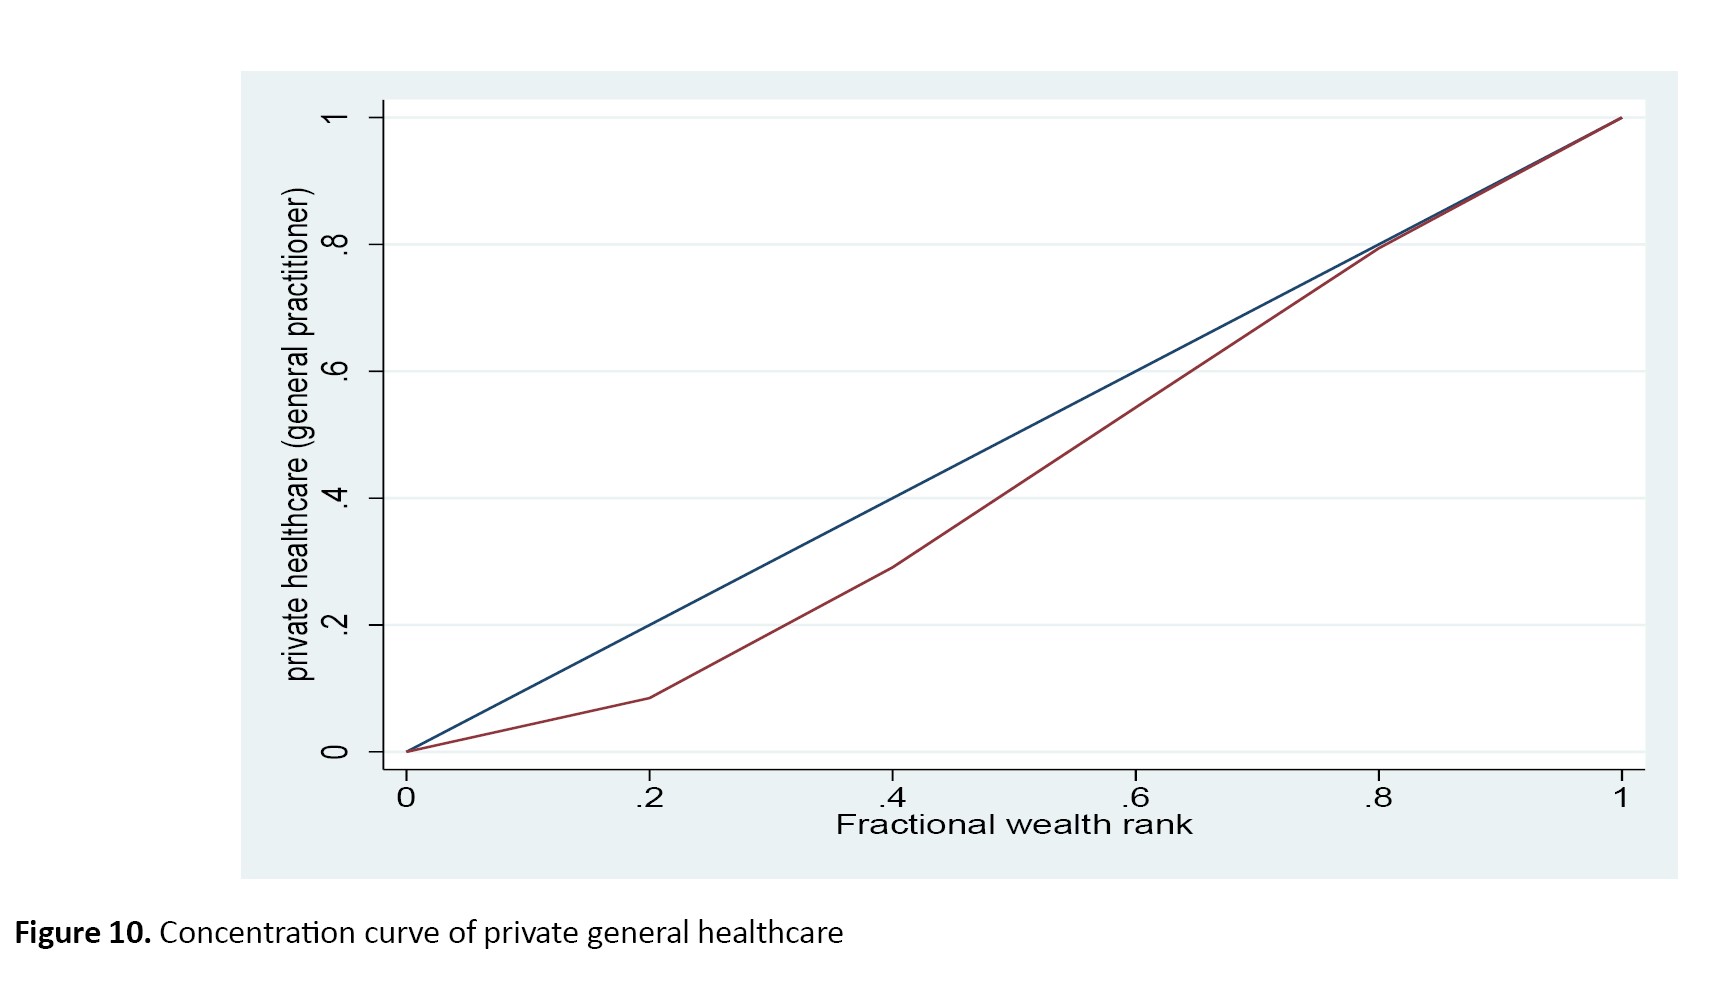
The Erreygers-corrected concentration index (CI) estimates revealed significant income-related inequalities in access to healthcare. Access to primary (CI=−0.1054; 95% CI, −0.1818, −0.029) and secondary healthcare (CI=−0.1063, 95% CI, −0.2047, −0.0079) was pro-poor, as indicated by the negative values and confidence intervals that did not include zero. In contrast, access to tertiary healthcare (CI=0.2382; 95% CI, 0.1645, 0.3119) and private general healthcare (CI=0.1502; 95% CI, 0.0585, 0.2419) was pro-rich, with positive and statistically significant indices (Table 2).
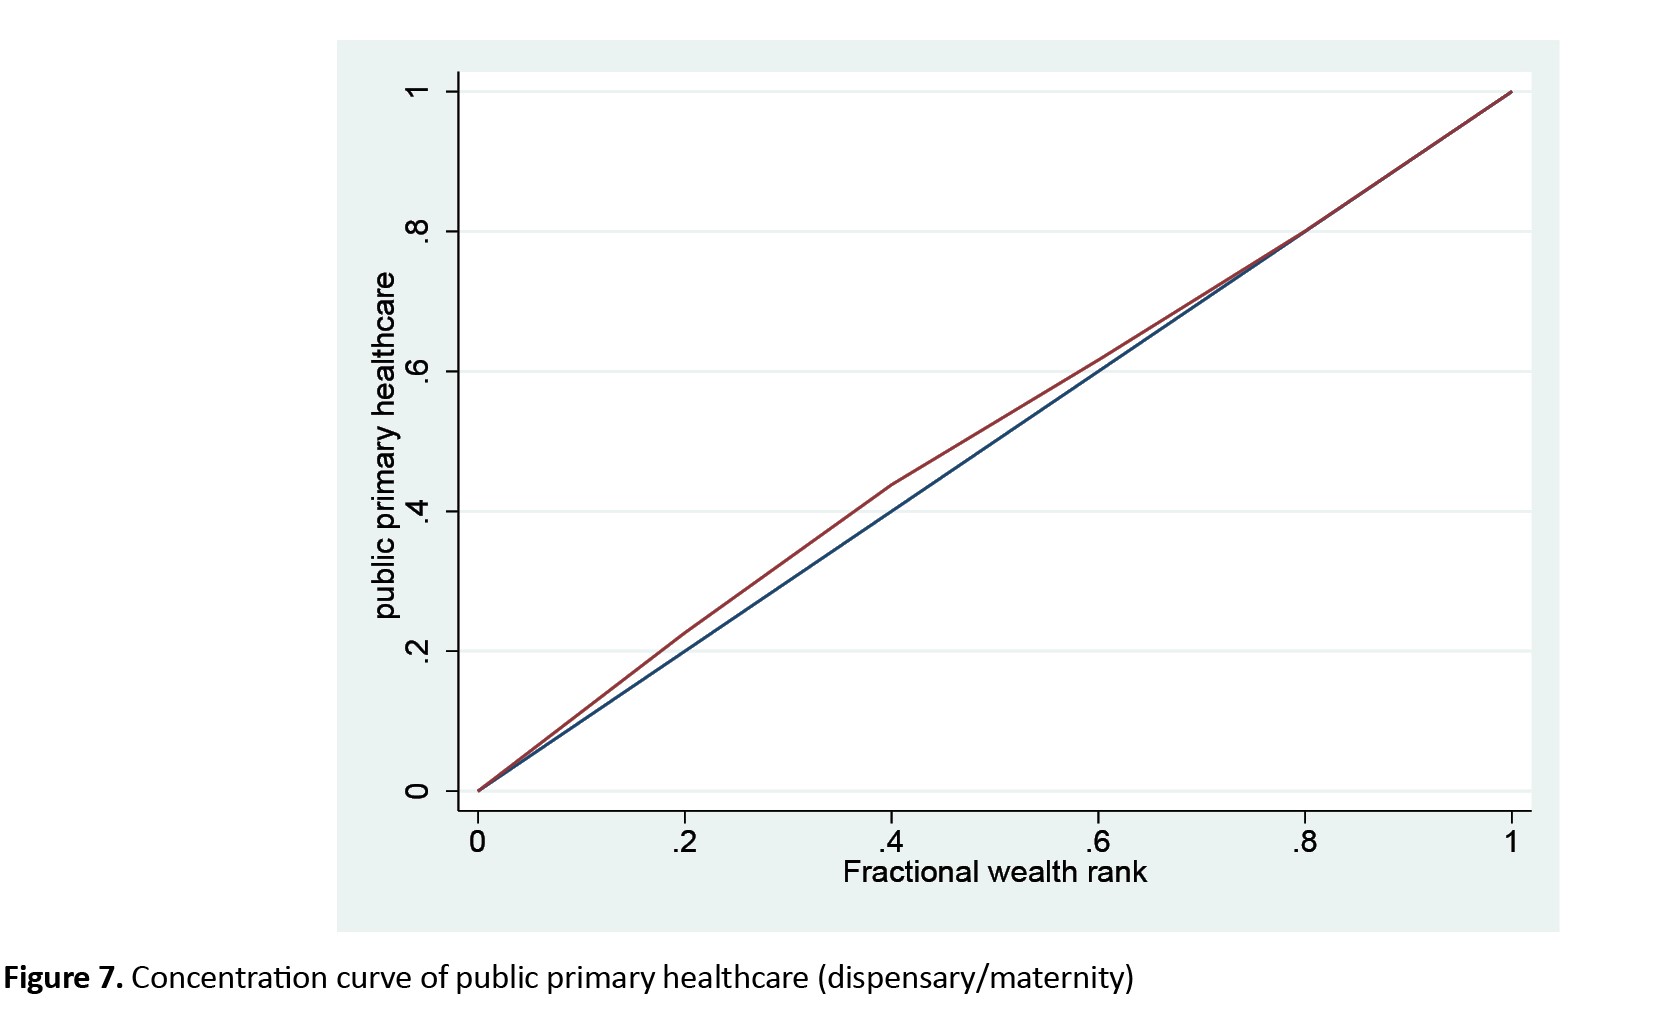
The concentration curves (Figure 7, 8, 9, and 10) corroborated these findings, lying above the line of equality for primary and secondary healthcare (indicating pro-poor distribution) and below the line of equality for tertiary and private general healthcare (indicating pro-rich distribution).
The magnitude of inequality was greatest in tertiary healthcare (CI=0.2382), while the strongest pro-poor inequality was observed in secondary healthcare (CI=−0.1063).
After adjusting for differences in healthcare needs, the HI provided further insights into inequity in access. For primary (HI=−0.0374) and secondary healthcare (HI=−0.0377), the indices remained pro-poor but were smaller in magnitude than the corresponding CIs. This suggested that part of the observed pro-poor inequality was attributable to differences in healthcare needs and that need standardization reduces the extent of inequality, indicating movement toward a more equitable distribution of these services.
However, for tertiary (HI=0.366) and private general healthcare (HI=0.218), the HI values exceeded their corresponding CIs. This indicates that, after controlling for healthcare need, access becomes even more concentrated among higher socioeconomic groups, implying a widening of pro-rich inequity. In other words, individuals with similar healthcare needs were more likely to utilize tertiary and private healthcare services if they were wealthier.
Decomposition of inequalities in access to inpatient healthcare
Table 3 presents the decomposition results for inequality in access to primary, secondary, tertiary, and private healthcare services.
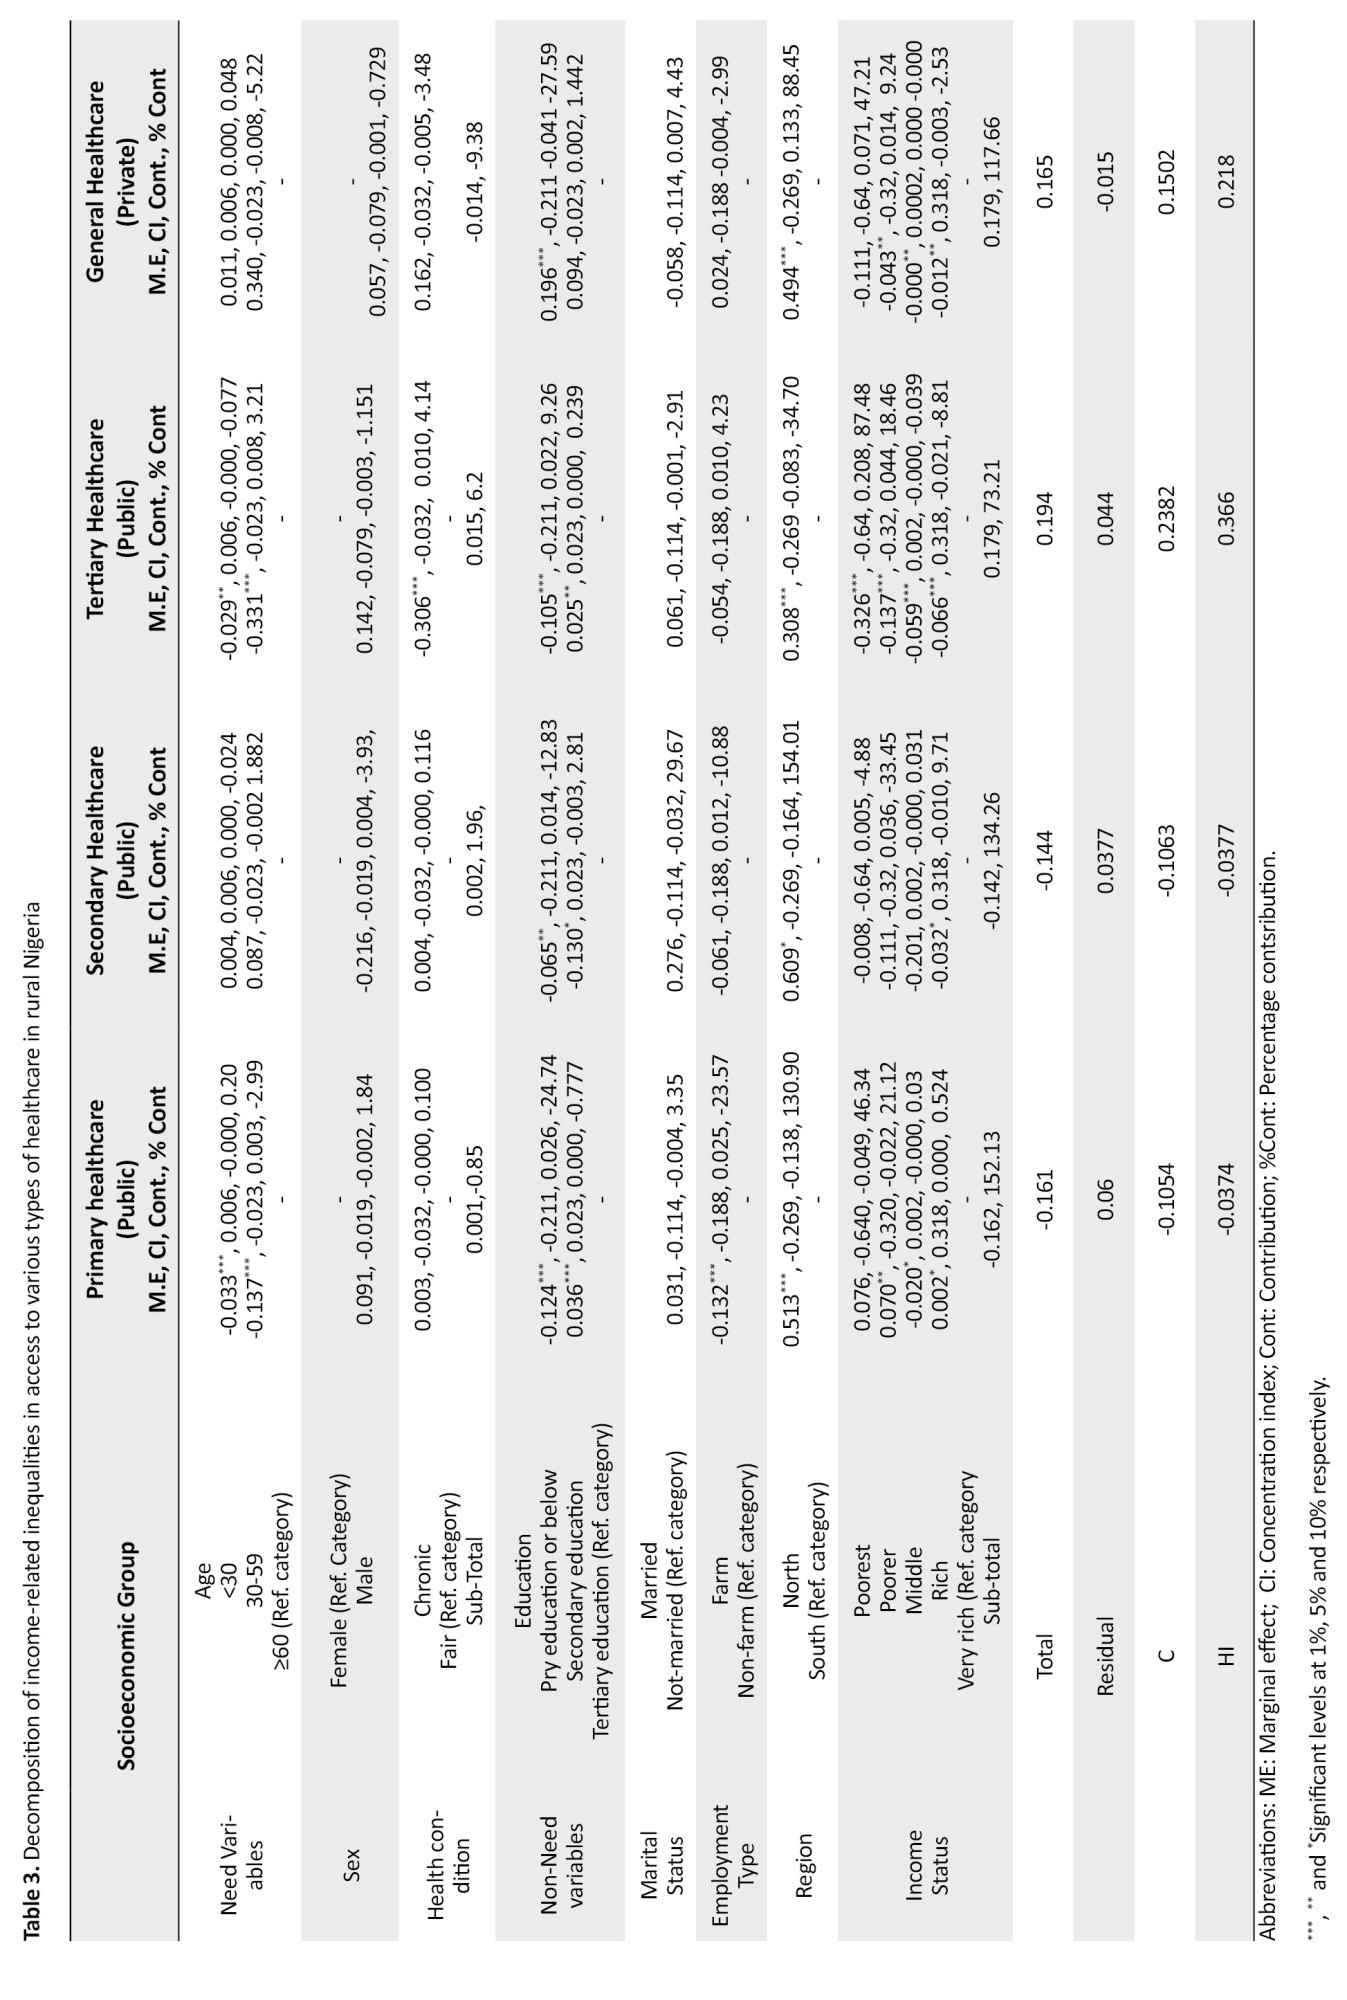
The key drivers of inequality differed across levels of healthcare provision. The first column showed the partial effect of socioeconomic factors on access to various types of healthcare; the second column showed the CI associated with each factor; the third column showed the absolute contribution of each factor to the overall CI; and the fourth column showed the percentage contribution.
A significant positive association was found between access to primary healthcare and respondents’ age, educational level, employment type, and region of residence. Compared with older respondents aged 60 years and above, individuals aged below 30 years and 30–59 years, those with at most primary education, individuals primarily engaged in farming, and residents of the southern region were less likely to access primary healthcare. Socio-demographic characteristics, such as being married, middle-aged (30–59 years), having primary education or less, primarily engaged in farming, reporting chronic health conditions, and residing in the rural northern region, were more concentrated among poorer households. Decomposition results indicated that need factors contributed only marginally to pro-poor inequality (0.001 [0.85%]), while non-need factors accounted for the largest share of inequality (-0.162 [152.13%]). Among the non-need factors, household economic status contributed the most to pro-poor inequality, suggesting that better-off households were less likely to utilize primary healthcare services conditional on need.
Access to secondary healthcare was significantly associated with educational attainment, geographic region, and household economic status. Compared with respondents with tertiary education, those with primary or secondary education were less likely to utilize secondary healthcare. Similarly, residents of the southern region and those in the second-highest income quintile, relative to the very rich income quintile, were less likely to access secondary healthcare. Several characteristics—including being male, married, middle-aged, having a chronic health condition, possessing only primary education, being primarily engaged in farming, and residing in the northern region—were disproportionately concentrated in poorer households. The decomposition results indicated that need factors contributed only a small share to the observed pro-rich inequality (0.002 [1.9%]). In contrast, non-need factors accounted for a substantially larger proportion of the inequality. Among these factors, residence in the northern region made the largest pro-poor contribution to inequality in secondary healthcare utilization (−0.269).
For tertiary healthcare, age, chronic health conditions, education, geographic location, and economic status were significantly associated with access. Compared with older individuals (60 years and above), respondents aged below 60 years, those with chronic health conditions, those with at least primary education, residents of the northern region, and those in the lower-income quintile were less likely to utilize tertiary healthcare than individuals in the highest-income quintile. As observed in the previous models, characteristics, such as being male, married, middle-aged, having at most a primary level of education, farming as the primary occupation, and residing in the northern region were more concentrated among poorer households. The decomposition results further showed that non-need factors accounted for a large share of the pro-rich inequality (0.179 [73.2%]), with household economic status contributing the largest proportion (0.231 [97%]).
Finally, access to private general healthcare was significantly associated with geographic region and household economic status. Residents of the northern region and individuals with lower incomes relative to the highest-income quintile were less likely to use private healthcare. Consistent with previous findings, several characteristics—including being male, married, middle-aged, reporting chronic health conditions, farming as the primary occupation, and residing in the northern region—were more prevalent among poorer households. Decomposition results indicated that non-need factors accounted for the largest share of pro-rich inequality (0.179 [117.6%)], with regional residence (North) contributing the largest share (88.45%).
Discussion
This study employed ECI and HI to examine income-related inequalities and inequities in access to different types of healthcare. Further, it decomposed these inequalities to identify the contributions of key socioeconomic factors.
The findings indicate that public primary healthcare is the most utilized level of care, while public tertiary healthcare is the least utilized. Across the different healthcare types, access was generally lower among females than among males, among younger individuals (below 30 years), and among those with at most primary education. Regionally, respondents in the Southwest had the highest access to public health services, while access to private healthcare was highest in the Southeast. In contrast, the lowest level of access to any form of healthcare was observed among residents in the Northeast.
The distribution of healthcare utilization across income groups shows that poorer households (first and second quintiles) predominantly use primary and secondary healthcare, whereas richer households (upper quintiles) were more likely to use tertiary and private general healthcare. This pattern is consistent with findings by Yaya et al. [45] for Malawi and Ogundele et al. [46] for Ghana.
The results further reveal significant pro-poor inequalities in access to public primary and secondary healthcare. However, after adjusting for differences in healthcare needs, the degree of pro-poor inequality decreased and approached zero, suggesting a more equitable distribution of these services. Oburota et al. [30] reported similar findings. This finding also aligns with that reported by Bose and Dutta [47] for India and by Zhang et al. [48] for China, but contrasts with that reported by Guo et al. [49] for rural China. The relative improvement in equity may reflect recent health sector reforms in Nigeria, including strengthening the National Health Insurance Authority, expanding service coverage, improving the health workforce registry, and increasing funding through the Basic Health Care Provision Fund.
In contrast, significant pro-rich inequalities were observed in accessing public tertiary and private general healthcare. These inequalities became more pronounced after controlling for healthcare needs, indicating that wealthier individuals are disproportionately more likely to access these services even when needs are similar. This suggests substantial inequities in higher-level and privately funded healthcare. Similar findings have been reported by Johar et al. [50] in Indonesia, Li et al. [51] in rural China, and Sharma et al. [52] in rural Bhutan.
While the relatively equitable distribution of primary and secondary healthcare suggests progress toward UHC, the persistence of pro-rich inequities in tertiary and private healthcare highlights important gaps in the healthcare system. This is particularly concerning in the context of the rising burden of NCDs in Nigeria, which requires specialized and often costly care. Evidence suggests that NCDs are projected to surpass infectious diseases as the leading cause of morbidity in Africa by 2030, with a substantial proportion of Nigerian adults at risk of premature mortality from conditions, such as cardiovascular diseases, cancer, respiratory diseases, and diabetes [53].
Socioeconomic and demographic factors also play a crucial role in healthcare utilization. Older individuals were more likely to utilize primary and tertiary health services, reflecting increased health needs with age [54]. However, individuals with chronic health conditions were less likely to access tertiary healthcare conditional on need, suggesting potential barriers to specialized care. Additionally, individuals with lower levels of education were less likely to utilize public healthcare but more likely to use private healthcare, highlighting the role of education in shaping healthcare-seeking behavior and access. These findings are consistent with previous studies [55] and are further supported by evidence that individuals from educationally disadvantaged backgrounds often face barriers to accessing high-quality health services [56].
Regional differences were also observed. Residents in Southern Nigeria were less likely to utilize primary health services, possibly due to relatively higher income levels and a preference for private or tertiary health services, where quality and advanced care are perceived to be better but require higher OOP expenditure. This aligns with evidence that wealthier individuals are less likely to rely on primary care but more likely to access specialized services [57]. Similar findings have been reported by Mostafavi et al. [58].
Decomposition analysis shows that need factors contribute minimally to observed inequalities, while non-need factors—particularly economic status and region of residence—account for the bulk of inequality. Economic status is the largest contributor to pro-rich inequality, whereas region of residence contributes most to pro-poor inequality, likely reflecting the geographic concentration of poorer populations in Northern Nigeria. For private healthcare, economic status remains the dominant driver of pro-rich inequality, while employment type contributes to pro-poor inequality, possibly due to the concentration of lower-income individuals in agricultural occupations. These findings are consistent with previous studies [59, 60].
Conclusion
This study provides evidence of significant socioeconomic inequalities in accessing inpatient healthcare across different levels of care in rural Nigeria. Access to public primary and secondary healthcare is pro-poor; however, these inequalities become less pronounced after adjusting for differences in healthcare needs, suggesting a movement toward a more equitable distribution. In contrast, access to public tertiary and private general healthcare is pro-rich, with inequalities becoming more pronounced after adjustment for need, indicating substantial inequities favoring higher-income groups.
The findings further reveal that these disparities are driven predominantly by non-need factors. Economic status contributes most to pro-rich inequalities, while region of residence contributes most to pro-poor inequalities, reflecting underlying geographic and socioeconomic disparities in healthcare access.
These results underscore the need for targeted policy interventions to improve equitable access to health services. In particular, there is a need to prioritize underserved populations in Northern and rural regions. Expanding the scope and depth of health insurance coverage—especially to include tertiary health services—could play a critical role in reducing pro-rich inequities in access to higher-level care. Additionally, strengthening public healthcare infrastructure and improving financial protection mechanisms will be essential to advancing progress toward UHC in Nigeria.
Study limitation
This study has a few limitations that should be acknowledged. First, the analysis relies in part on self-reported information regarding respondents’ health conditions. Such measures are inherently subjective and may be influenced by recall bias or measurement errors, which could affect the accuracy of the reported health status and healthcare utilization. Second, the survey was conducted during a period of heightened insecurity in some parts of Nigeria, which made several rural communities difficult or unsafe to access for field data collection. As a result, it was not possible to obtain a fully representative sample across all rural areas. Nevertheless, the sample weights were adjusted to account for the sampling design, thereby reducing potential bias in the estimates. Future studies can benefit from mixed-methods approaches to better investigate and mitigate potential non-response and selection biases that are not adequately captured through quantitative analysis alone. Despite these limitations, the study provides important empirical evidence on income-related inequalities and inequities in access to inpatient healthcare in rural Nigeria, offering useful insights for policymakers seeking to reduce disparities and improve equity in the healthcare system.
Ethical Considerations
Compliance with ethical guidelines
Approval was sought from the National Health Research Ethics Committee of Nigeria (NHREC), Abuja, Nigeria. Participants were informed of the purpose of the study and individual written consent was obtained. They were assured that the confidentiality of the information obtained would be maintained and that it would be used only for the study.
Funding
This study was supported by the African Economic Research Consortium, which funded the main research from which the data used in this analysis were obtained.
Authors contributions
Study proposal: Abdul Majeed Yaqoob and Afees Salisu; Sample size design and sampling procedure: Obumneke Ezie; Statistical analyses and writing the original draft: Abdul Majeed Yaqoob; Conceptualization, review, editing and final approval: All authors.
Conflict of interest
The authors declared no conflict of interest.
Acknowledgements
The authors acknowledge the contributions of Alh. Musa Seriki for his support in sourcing field enumerators, particularly from the Northern region; facilitating engagement with key stakeholders, including community leaders and heads of health facilities; and assisting with data collection for this study.
After adjusting for differences in healthcare needs, the HI provided further insights into inequity in access. For primary (HI=−0.0374) and secondary healthcare (HI=−0.0377), the indices remained pro-poor but were smaller in magnitude than the corresponding CIs. This suggested that part of the observed pro-poor inequality was attributable to differences in healthcare needs and that need standardization reduces the extent of inequality, indicating movement toward a more equitable distribution of these services.
However, for tertiary (HI=0.366) and private general healthcare (HI=0.218), the HI values exceeded their corresponding CIs. This indicates that, after controlling for healthcare need, access becomes even more concentrated among higher socioeconomic groups, implying a widening of pro-rich inequity. In other words, individuals with similar healthcare needs were more likely to utilize tertiary and private healthcare services if they were wealthier.
Decomposition of inequalities in access to inpatient healthcare
Table 3 presents the decomposition results for inequality in access to primary, secondary, tertiary, and private healthcare services.
The key drivers of inequality differed across levels of healthcare provision. The first column showed the partial effect of socioeconomic factors on access to various types of healthcare; the second column showed the CI associated with each factor; the third column showed the absolute contribution of each factor to the overall CI; and the fourth column showed the percentage contribution.
A significant positive association was found between access to primary healthcare and respondents’ age, educational level, employment type, and region of residence. Compared with older respondents aged 60 years and above, individuals aged below 30 years and 30–59 years, those with at most primary education, individuals primarily engaged in farming, and residents of the southern region were less likely to access primary healthcare. Socio-demographic characteristics, such as being married, middle-aged (30–59 years), having primary education or less, primarily engaged in farming, reporting chronic health conditions, and residing in the rural northern region, were more concentrated among poorer households. Decomposition results indicated that need factors contributed only marginally to pro-poor inequality (0.001 [0.85%]), while non-need factors accounted for the largest share of inequality (-0.162 [152.13%]). Among the non-need factors, household economic status contributed the most to pro-poor inequality, suggesting that better-off households were less likely to utilize primary healthcare services conditional on need.
Access to secondary healthcare was significantly associated with educational attainment, geographic region, and household economic status. Compared with respondents with tertiary education, those with primary or secondary education were less likely to utilize secondary healthcare. Similarly, residents of the southern region and those in the second-highest income quintile, relative to the very rich income quintile, were less likely to access secondary healthcare. Several characteristics—including being male, married, middle-aged, having a chronic health condition, possessing only primary education, being primarily engaged in farming, and residing in the northern region—were disproportionately concentrated in poorer households. The decomposition results indicated that need factors contributed only a small share to the observed pro-rich inequality (0.002 [1.9%]). In contrast, non-need factors accounted for a substantially larger proportion of the inequality. Among these factors, residence in the northern region made the largest pro-poor contribution to inequality in secondary healthcare utilization (−0.269).
For tertiary healthcare, age, chronic health conditions, education, geographic location, and economic status were significantly associated with access. Compared with older individuals (60 years and above), respondents aged below 60 years, those with chronic health conditions, those with at least primary education, residents of the northern region, and those in the lower-income quintile were less likely to utilize tertiary healthcare than individuals in the highest-income quintile. As observed in the previous models, characteristics, such as being male, married, middle-aged, having at most a primary level of education, farming as the primary occupation, and residing in the northern region were more concentrated among poorer households. The decomposition results further showed that non-need factors accounted for a large share of the pro-rich inequality (0.179 [73.2%]), with household economic status contributing the largest proportion (0.231 [97%]).
Finally, access to private general healthcare was significantly associated with geographic region and household economic status. Residents of the northern region and individuals with lower incomes relative to the highest-income quintile were less likely to use private healthcare. Consistent with previous findings, several characteristics—including being male, married, middle-aged, reporting chronic health conditions, farming as the primary occupation, and residing in the northern region—were more prevalent among poorer households. Decomposition results indicated that non-need factors accounted for the largest share of pro-rich inequality (0.179 [117.6%)], with regional residence (North) contributing the largest share (88.45%).
Discussion
This study employed ECI and HI to examine income-related inequalities and inequities in access to different types of healthcare. Further, it decomposed these inequalities to identify the contributions of key socioeconomic factors.
The findings indicate that public primary healthcare is the most utilized level of care, while public tertiary healthcare is the least utilized. Across the different healthcare types, access was generally lower among females than among males, among younger individuals (below 30 years), and among those with at most primary education. Regionally, respondents in the Southwest had the highest access to public health services, while access to private healthcare was highest in the Southeast. In contrast, the lowest level of access to any form of healthcare was observed among residents in the Northeast.
The distribution of healthcare utilization across income groups shows that poorer households (first and second quintiles) predominantly use primary and secondary healthcare, whereas richer households (upper quintiles) were more likely to use tertiary and private general healthcare. This pattern is consistent with findings by Yaya et al. [45] for Malawi and Ogundele et al. [46] for Ghana.
The results further reveal significant pro-poor inequalities in access to public primary and secondary healthcare. However, after adjusting for differences in healthcare needs, the degree of pro-poor inequality decreased and approached zero, suggesting a more equitable distribution of these services. Oburota et al. [30] reported similar findings. This finding also aligns with that reported by Bose and Dutta [47] for India and by Zhang et al. [48] for China, but contrasts with that reported by Guo et al. [49] for rural China. The relative improvement in equity may reflect recent health sector reforms in Nigeria, including strengthening the National Health Insurance Authority, expanding service coverage, improving the health workforce registry, and increasing funding through the Basic Health Care Provision Fund.
In contrast, significant pro-rich inequalities were observed in accessing public tertiary and private general healthcare. These inequalities became more pronounced after controlling for healthcare needs, indicating that wealthier individuals are disproportionately more likely to access these services even when needs are similar. This suggests substantial inequities in higher-level and privately funded healthcare. Similar findings have been reported by Johar et al. [50] in Indonesia, Li et al. [51] in rural China, and Sharma et al. [52] in rural Bhutan.
While the relatively equitable distribution of primary and secondary healthcare suggests progress toward UHC, the persistence of pro-rich inequities in tertiary and private healthcare highlights important gaps in the healthcare system. This is particularly concerning in the context of the rising burden of NCDs in Nigeria, which requires specialized and often costly care. Evidence suggests that NCDs are projected to surpass infectious diseases as the leading cause of morbidity in Africa by 2030, with a substantial proportion of Nigerian adults at risk of premature mortality from conditions, such as cardiovascular diseases, cancer, respiratory diseases, and diabetes [53].
Socioeconomic and demographic factors also play a crucial role in healthcare utilization. Older individuals were more likely to utilize primary and tertiary health services, reflecting increased health needs with age [54]. However, individuals with chronic health conditions were less likely to access tertiary healthcare conditional on need, suggesting potential barriers to specialized care. Additionally, individuals with lower levels of education were less likely to utilize public healthcare but more likely to use private healthcare, highlighting the role of education in shaping healthcare-seeking behavior and access. These findings are consistent with previous studies [55] and are further supported by evidence that individuals from educationally disadvantaged backgrounds often face barriers to accessing high-quality health services [56].
Regional differences were also observed. Residents in Southern Nigeria were less likely to utilize primary health services, possibly due to relatively higher income levels and a preference for private or tertiary health services, where quality and advanced care are perceived to be better but require higher OOP expenditure. This aligns with evidence that wealthier individuals are less likely to rely on primary care but more likely to access specialized services [57]. Similar findings have been reported by Mostafavi et al. [58].
Decomposition analysis shows that need factors contribute minimally to observed inequalities, while non-need factors—particularly economic status and region of residence—account for the bulk of inequality. Economic status is the largest contributor to pro-rich inequality, whereas region of residence contributes most to pro-poor inequality, likely reflecting the geographic concentration of poorer populations in Northern Nigeria. For private healthcare, economic status remains the dominant driver of pro-rich inequality, while employment type contributes to pro-poor inequality, possibly due to the concentration of lower-income individuals in agricultural occupations. These findings are consistent with previous studies [59, 60].
Conclusion
This study provides evidence of significant socioeconomic inequalities in accessing inpatient healthcare across different levels of care in rural Nigeria. Access to public primary and secondary healthcare is pro-poor; however, these inequalities become less pronounced after adjusting for differences in healthcare needs, suggesting a movement toward a more equitable distribution. In contrast, access to public tertiary and private general healthcare is pro-rich, with inequalities becoming more pronounced after adjustment for need, indicating substantial inequities favoring higher-income groups.
The findings further reveal that these disparities are driven predominantly by non-need factors. Economic status contributes most to pro-rich inequalities, while region of residence contributes most to pro-poor inequalities, reflecting underlying geographic and socioeconomic disparities in healthcare access.
These results underscore the need for targeted policy interventions to improve equitable access to health services. In particular, there is a need to prioritize underserved populations in Northern and rural regions. Expanding the scope and depth of health insurance coverage—especially to include tertiary health services—could play a critical role in reducing pro-rich inequities in access to higher-level care. Additionally, strengthening public healthcare infrastructure and improving financial protection mechanisms will be essential to advancing progress toward UHC in Nigeria.
Study limitation
This study has a few limitations that should be acknowledged. First, the analysis relies in part on self-reported information regarding respondents’ health conditions. Such measures are inherently subjective and may be influenced by recall bias or measurement errors, which could affect the accuracy of the reported health status and healthcare utilization. Second, the survey was conducted during a period of heightened insecurity in some parts of Nigeria, which made several rural communities difficult or unsafe to access for field data collection. As a result, it was not possible to obtain a fully representative sample across all rural areas. Nevertheless, the sample weights were adjusted to account for the sampling design, thereby reducing potential bias in the estimates. Future studies can benefit from mixed-methods approaches to better investigate and mitigate potential non-response and selection biases that are not adequately captured through quantitative analysis alone. Despite these limitations, the study provides important empirical evidence on income-related inequalities and inequities in access to inpatient healthcare in rural Nigeria, offering useful insights for policymakers seeking to reduce disparities and improve equity in the healthcare system.
Ethical Considerations
Compliance with ethical guidelines
Approval was sought from the National Health Research Ethics Committee of Nigeria (NHREC), Abuja, Nigeria. Participants were informed of the purpose of the study and individual written consent was obtained. They were assured that the confidentiality of the information obtained would be maintained and that it would be used only for the study.
Funding
This study was supported by the African Economic Research Consortium, which funded the main research from which the data used in this analysis were obtained.
Authors contributions
Study proposal: Abdul Majeed Yaqoob and Afees Salisu; Sample size design and sampling procedure: Obumneke Ezie; Statistical analyses and writing the original draft: Abdul Majeed Yaqoob; Conceptualization, review, editing and final approval: All authors.
Conflict of interest
The authors declared no conflict of interest.
Acknowledgements
The authors acknowledge the contributions of Alh. Musa Seriki for his support in sourcing field enumerators, particularly from the Northern region; facilitating engagement with key stakeholders, including community leaders and heads of health facilities; and assisting with data collection for this study.
References
- World Health Organization, World Bank. Tracking universal health coverage: 2023 global monitoring report. Geneva: WHO; 2023. [Link]
- United Nations. Transforming our world: The 2030 agenda for sustainable development. New York: United Nations; 2015. [Link]
- World Health Organization.Universal health coverage (UHC). Geneva: WHO; 2025. [Link]
- World Health Organization, United Nations Children’s Fund (UNICEF). Declaration of Astana on primary health care. Geneva: WHO; 2018. [Link]
- Okeke C, Ezenwaka U, Ekenna A, Onyedinma C, Onwujekwe O. Analysing the progress in service delivery towards achieving universal health coverage in Nigeria: A scoping review. BMC Health Services Research. 2023; 23(1):1094. [DOI:10.1186/s12913-023-10090-w] [PMID]
- Wagstaff A, Neelsen S. A comprehensive assessment of universal health coverage in 111 countries: A retrospective observational study. The Lancet. Global Health. 2020; 8(1):e39-e49. [DOI:10.1016/S2214-109X(19)30463-2] [PMID]
- Allen LN, Pettigrew LM, Exley J, Collin H, Bates S, Kidd M. Global health inequity and primary care. BJGP Open. 2024; 8(4):BJGPO.2024.0189. [DOI:10.3399/BJGPO.2024.0189] [PMID]
- Hosseinpoor AR, Bergen N, Schlotheuber A, Grove J. Measuring health inequalities in the context of sustainable development goals. Bulletin of The World Health Organization. 2018; 96(9):654-9. [PMID]
- Barasa E, Kazungu J, Nguhiu P, Ravishankar N. Examining the level and inequality in health insurance coverage in 36 sub-Saharan African countries. BMJ Global Health. 2021; 6(4):e004712. [DOI:10.1136/bmjgh-2020-004712] [PMID]
- World Health Organization. Trends in maternal mortality 2000 to 2020: estimates by WHO, UNICEF, UNFPA, World Bank Group and UNDESA/Population Division. Geneva: WHO; 2023. [Link]
- World Health Organization. Maternal health in Nigeria: Generating information for action. Geneva: WHO; 2019. [Link]
- World Bank. Maternal mortality risk (modeled estimate, %). Washington (DC): World Bank; 2025. [Link]
- World Health Organization. Annual report 2024.Geneva: WHO; 2024. [Link]
- Okoli C, Hajizadeh M, Rahman MM, Khanam R. Geographical and socioeconomic inequalities in the utilization of maternal healthcare services in Nigeria: 2003-2017. BMC Health Services Research. 2020; 20(1):849. [DOI:10.1186/s12913-020-05700-w] [PMID]
- National Population Commission (NPC) [Nigeria] and ICF. Nigeria demographic and health survey 2021. Abuja, Nigeria; 2022. [Link]
- World Health Organization. Global health estimates: Life expectancy and leading causes of death. Geneva: WHO; 2022. [Link]
- Olawade DB, Wada OZ, Aderinto N, Odetayo A, Adebisi YA, Esan DT, Ling J. Factors contributing to under-5 child mortality in Nigeria: A narrative review. Medicine (Baltimore). 2025; 104(1):e41142. [DOI:10.1097/md.0000000000041142] [PMID]
- World Health Organization. Noncommunicable diseases progress monitor 2022. Geneva: World Health Organization; 2022. [Link]
- Oso A. Non communicable Diseases: An Emerging Epidemic in Nigeria. Tropical Journal of Nephrology. 2023; 18(1-2):31-7. [Link]
- GBD 2021 Risk Factors Collaborators. Global burden and strength of evidence for 88 risk factors in 204 countries and 811 subnational locations, 1990-2021: a systematic analysis for the Global Burden of Disease Study 2021. Lancet. 2024; 403(10440):2162-203. [DOI:10.1016/s0140-6736(24)00933-4] [PMID]
- Aniebo CL, Lawani LO, Eze P. The burden and socioeconomic inequality in catastrophic out-of-pocket health expenditure in post-pandemic Nigeria. Global Social Welfare. 2025; 13:205-18. [DOI:10.1007/s40609-025-00423-4]
- Essien NL. Financial risk protection and Nigeria’s journey towards universal health coverage. npj Health Systems. 2025; 2:17. [DOI:10.1038/s44401-025-00021-8]
- Koce F, Randhawa G, Ochieng B. Understanding healthcare self-referral in Nigeria from the service users’ perspective: A qualitative study of Niger State. BMC Health Services Research. 2019; 19(1):209. [DOI:10.1186/s12913-019-4046-9] [PMID]
- Federal Ministry of Health (Nigeria). Second National Strategic Health Development Plan 2018–2022: Ensuring healthy lives and promoting the wellbeing of the Nigerian populace at all ages. Abuja, Nigeria: Federal Ministry of Health; 2018. [Link]
- Haakenstad A, Yearwood JA, Fullman N, Bintz C, Bienhoff K, Weaver MR, et al. Assessing performance of the healthcare access and quality index, overall and by selected age groups, for 204 countries and territories, 1990-2019: A systematic analysis from the global burden of disease study 2019. The Lancet Global Health. 2022; 10(12):e1715-43. [Link]
- Xu J, Tian G, Sun J, Liu J, Chen F, Shi Q, et al. Horizontal inequity trends of health care utilization in rural China after the medicine and healthcare system reform: Based on longitudinal data from 2010 to 2018. International Journal for Equity in Health. 2023; 22(1):90. [DOI:10.1186/s12939-023-01908-4] [PMID]
- Garcia-Ramirez J, Nikoloski Z, Mossialos E. Inequality in healthcare use among older people in Colombia. International Journal for Equity in Health. 2020; 19(1):168. [DOI:10.1186/s12939-020-01241-0] [PMID]
- Zhang C, Lun H, Ma J, Zhou Y. Income inequality and healthcare utilization of the older adults-based on a study in three provinces and six cities in China. Frontiers in Public Health. 2024; 12:1435162. [DOI:10.3389/fpubh.2024.1435162] [PMID]
- Kawakatsu Y, Adolph C, Mosser JF, Baffoe P, Cheshi F, Aiga H, et al. Factors consistently associated with utilization of essential maternal and child health services in Nigeria: Analysis of five national surveys (2003-2018). BMJ Open. 2022; 12(9):e061747. [DOI:10.1136/bmjopen-2022-061747] [PMID]
- Oburota CS, Okungbowa EF, Eke FA. Socioeconomic inequalities in maternal health care utilization and delivery channels in Nigeria. Journal of Population and Social Studies. 2023; 31:672-95. [Link]
- World Bank. Rural population (% of total population) - Nigeria. Washington: World Bank; 2025. [Link]
- Kish L. Survey sampling. New York: John Wiley & Sons; 1965. [Link]
- Oseni G, Palacios-Lopez A, Mugera HK, Durazo J. Capturing What Matters: Essential Guidelines for Designing Household Surveys. 2nd ed. Washington (DC): World Bank; 2021. [Link]
- Levesque J F, Harris MF, Russell G. Patient centred access to health care: Conceptualising access at the interface of health systems and populations. International Journal for Equity in Health. 2013; 12:18. [DOI:10.1186/1475-9276-12-18] [PMID]
- Clarke D, Doer S, Hauter M, Schmets G, Soucat A, Paviza A. The private sector and universal health coverage. Bulletin of The World Health Organization. 2019; 97(6):434-35. [PMID]
- Sudhinaraset M, Ingram M, Lofthouse HK, Montagu D. What is the role of informal healthcare providers in developing countries? A systematic review. PLoS One. 2013; 8(2):e54978. [DOI:10.1371/journal.pone.0054978] [PMID]
- Andersen RM. Revisiting the behavioral model and access to medical care: Does it matter? Journal of Health and Social Behavior. 1995; 36(1):1-10. [DOI:10.2307/2137284] [PMID]
- Wossen T, Alene AD, Abdoulaye T. Poverty reduction effects of technology adoption: Evidence from Nigeria. Proceedings of the International Association of Agricultural Economists Conference, Vancouver, British Columbia. 2019. [DOI:10.22004/ag.econ.276980]
- World Bank. Living Standards Measurement Study. Consumption and welfare. Washington (DC): World Bank; 2025. [Link]
- Shen Y, Yan H, Reija K, Li Q, Xiao S, Gao J, et al. Equity in use of maternal health services in western rural China: A survey from Shaanxi province. BMC Health Services Research. 2014; 14:155. [DOI:10.1186/1472-6963-14-155] [PMID]
- Erreygers G. Correcting the concentration index. Journal of Health Economics. 2009; 28(2):504-15. [DOI:10.1016/j.jhealeco.2008.02.003] [PMID]
- Wagstaff A. Health equity and financial protection: Streamlined analysis with ADePT software. Washington: World Bank Publications; 2011. [Link]
- Van Doorslaer E, Wagstaff A, Bleichrodt H, Calonge S, Gerdtham UG, Gerfin M, et al. Income-related inequalities in health: Some international comparisons. Journal of Health Economics. 1997; 16(1):93-112. [DOI:10.1016/S0167-6296(96)00532-2] [PMID]
- Erreygers G, Kessels R. Regression based decompositions of rank dependent indicators of socioeconomic inequality of health. Research on Economic Inequality. 2013; 21:227-259. [DOI:10.1108/S1049-2585(2013)0000021010]
- Yaya S, Bishwajit G, Shah V. Wealth, education and urban-rural inequality and maternal healthcare service usage in Malawi. BMJ Global Health. 2016; 1(2):e000085. [DOI:10.1136/bmjgh-2016-000085] [PMID]
- Ogundele OJ, Pavlova M, Groot W. Examining trends in inequality in the use of reproductive health care services in Ghana and Nigeria. BMC Pregnancy and Childbirth. 2018; 18(1):492. [DOI:10.1186/s12884-018-2102-9] [PMID]
- Bose M, Dutta A. Inequity in hospitalization care: a study on utilization of healthcare services in West Bengal, India. International Journal of Health Policy and Management. 2014; 4(1):29-38. [DOI:10.15171/ijhpm.2015.05] [PMID]
- Zhang T, Liu C, Liu L, Gan Y, Lu W, Tao H. General practice for the poor and specialist services for the rich: Inequality evidence from a cross-sectional survey on Hangzhou residents, China. International Journal for Equity in Health. 2019; 18(1):69. [DOI:10.1186/s12939-019-0966-6] [PMID]
- Guo B, Xie X, Wu Q, Zhang X, Cheng H, Tao S, et al. Inequality in the health services utilization in rural and urban china: A horizontal inequality analysis. Medicine (Baltimore). 2020; 99(2):e18625. [DOI:10.1097/md.0000000000018625] [PMID]
- Johar M, Soewondo P, Pujisubekti R, Satrio HK, Adji A. Inequality in access to health care, health insurance and the role of supply factors. Soc Sci Med. 2018; 213:134-45. [DOI:10.1016/j.socscimed.2018.07.044] [PMID]
- Li D, Zhang J, Yang J, Xu Y, Lyu R, Zhong L, et al. Socio-economic inequalities in health service utilization among Chinese rural migrant workers with New Cooperative Medical Scheme: A multilevel regression approach. BMC Public Health. 2022; 22(1):1110.[DOI:10.1186/s12889-022-13486-1] [PMID]
- Sharma J, Pavlova M, Groot W. Rural-urban inequalities in health care utilization in Bhutan: A decomposition analysis. Int J Equity Health. 2024; 23(1):69. [DOI:10.1186/s12939-024-02178-4] [PMID]
- Odunyemi A, Rahman T, Alam K. Economic burden of non-communicable diseases on households in Nigeria: Evidence from the Nigeria Living Standard Survey 2018-19. BMC Public Health. 2023; 23(1):1563. [DOI:10.1186/s12889-023-16498-7] [PMID]
- World Health Organization (WHO). Ageing and health. Geneva: WHO; 2021. [Link]
- Nyamande FN, Mosquera PA, San Sebastián M, Gustafsson PE. Intersectional equity in health care: Assessing complex inequities in primary and secondary care utilization by gender and education in northern Sweden. Int J Equity Health. 2020; 19(1):159. [DOI:10.1186/s12939-020-01272-7] [PMID]
- Turner AJ, Francetic I, Watkinson R, Gillibrand S, Sutton M. Socioeconomic inequality in access to timely and appropriate care in emergency departments. J Health Econ. 2022; 85:102668. [DOI:10.1016/j.jhealeco.2022.102668] [PMID]
- Lueckmann SL, Hoebel J, Roick J, Markert J, Spallek J, von dem Knesebeck O, et al. Socioeconomic inequalities in primary-care and specialist physician visits: A systematic review. Int J Equity Health. 2021; 20(1):58. [DOI:10.1186/s12939-020-01375-1] [PMID]
- Mostafavi F, Piroozi B, Mosquera P, Majdzadeh R, Moradi G. Assessing horizontal equity in health care utilization in Iran: A decomposition analysis. BMC Public Health. 2020; 20(1):914. [DOI:10.1186/s12889-020-09071-z] [PMID]
- Nwosu CO, Ataguba JE. Socioeconomic inequalities in maternal health service utilisation: A case of antenatal care in Nigeria using a decomposition approach. BMC Public Health. 2019; 19(1):1493. [DOI:10.1186/s12889-019-7840-8] [PMID]
- Okoli CI, Hajizadeh M, Rahman MM, Khanam R. Decomposition of socioeconomic inequalities in the uptake of intermittent preventive treatment of malaria in pregnancy in Nigeria: Evidence from Demographic Health Survey. Malar J. 2021; 20(1):300. [DOI:10.1186/s12936-021-03834-8] [PMID]
Type of Study: Original Article |
Subject:
Health Economics
Send email to the article author
| Rights and permissions | |
 |
This work is licensed under a Creative Commons Attribution-NonCommercial 4.0 International License. |

This is an open access article distributed under the terms of the Creative Commons Attribution License (CC-By-NC), which permits use, distribution, and reproduction in any medium, provided the original work is properly cited and is not used for commercial purposes.
Contact Information