

Volume 11, Issue 1 (Winter 2023)
Iran J Health Sci 2023, 11(1): 1-12 |
Back to browse issues page


Ethics code: Reference number BREC/00000523/2019
Clinical trials code: NCT 04431115
Download citation:
BibTeX | RIS | EndNote | Medlars | ProCite | Reference Manager | RefWorks
Send citation to:


BibTeX | RIS | EndNote | Medlars | ProCite | Reference Manager | RefWorks
Send citation to:
Ojedoyin O O, Nadasan T, Olagbegi O M, Govender P. Prevalence of Low Physical Fitness and Its Related Factors Among Primary School Learners in Lagos State, Nigeria. Iran J Health Sci 2023; 11 (1) :1-12
URL: http://jhs.mazums.ac.ir/article-1-848-en.html
URL: http://jhs.mazums.ac.ir/article-1-848-en.html
Olusegun Olatunji Ojedoyin 

 , Thayananthee Nadasan , Oladapo Michael Olagbegi * , Pragashnie Govender
, Thayananthee Nadasan , Oladapo Michael Olagbegi * , Pragashnie Govender
Department of Physiotherapy, School of Health Sciences, University of KwaZulu- Natal, Durban, South Africa. , olusegunojedoyin@gmail.com
Full-Text [PDF 918 kb]
(407 Downloads)
| Abstract (HTML) (1037 Views)
Full-Text: (266 Views)
1. Introduction
Recent studies have shown a decline in physical fitness (PF) among children and adolescents in Africa and worldwide [1, 2]. This has resulted in an increased risk of poor cardiorespiratory fitness and an unexpected increase in cardiovascular morbidity and mortality [3]. Although most of these ailments appear with age, their origins can be traced back to infancy [4].
However, PF is defined as the ability to complete daily chores with vigor and alertness, without undue exhaustion, and with sufficient energy to enjoy leisure activities as well as to deal with unforeseen situations [3]. PF is influenced by a variety of quantitative factors. These include age, nutrition, and regular medical checkups [5]. Most components of fitness are divided into two categories, health-related and non-health-related. PF in early childhood is a powerful marker of health and can be divided into two broad categories, such as health-related fitness which includes aerobic fitness, muscular strength, muscular endurance, and flexibility, and skill-related fitness, including agility, balance, coordination, power, reaction time, and speed [5].
PF is essential to perform even a minimal level of activity without physical fatigue [6]. To perform daily activities without fatigue, it is necessary to be optimal in five areas of PF, which are cardiorespiratory endurance, muscular strength and endurance, flexibility, and body composition [7]. When we develop these areas as humans, our overall quality of life (QoL) will improve, lowering the risk of chronic diseases and eventually optimizing our health and well-being [8]. Cardiorespiratory endurance is the ability to perform prolonged, large-muscle, dynamic movements at a moderate to high level of intensity. This can mean the ability of your heart to pump blood and the ability of your lungs to efficiently receive oxygen [8].
Higher PF level is associated with higher levels of health-related quality of life (HRQoL) in elderly and chronically ill populations [9, 10]. However, prevention of risk factors, such as childhood obesity is effective through increased PF, which can enhance individuals’ mental and physical health [11, 12]. Lack of or reduced fitness causes children to lose the metabolic effect of fitness protecting them from excessive weight gain and metabolic diseases [13]. The report by Leppanen and colleagues further suggests that poor PF, inactive physical activity (PA), and increased risk of cardiovascular disease are all associated [14].
Moderate to vigorous physical activity (PA) is recommended to improve PF and thus prevent overweight and obesity in children [15]. PF is now recognized as a critical modern measure of childhood health and QoL. Better academic performance is associated with higher levels of fitness among primary school children [16].
In the recent past, the levels of activity have shifted significantly. Outdoor physical activity is rapidly supplemented by less physically demanding indoor activities [17]. Automobiles are used to transport students to school instead of cycling or walking. The number of people walking and participating in organized sports is decreasing [17]. The potential consequences of these alterations on children’s development and health have been a cause of concern to researchers and policymakers.
According to the United Nations, World population prospects, 43.8% of Nigeria’s population of 206 million were younger than 15 years in 2019 [18]. Every child has the right to life, which means that each child needs to be well-cared for to survive and develop normally. Childhood and adolescence are critical stages of life because they are marked by significant physiological and psychological changes. Similarly, during these years, a person’s lifestyle and healthy/unhealthy behaviours are formed, which may affect the behaviour and health status of adults [19].
PF is known to be influenced by environmental factors [20]. This suggests that, as active transportation reduces, the prevalence of noncommunicable diseases may rise unless adequate measures are taken, and that other anthropometric factors may affect PF.
However, African studies examining the prevalence of low PF levels, and their associations with cardiovascular, sociodemographic, and anthropometric factors in Nigerian school children are very scarce. Therefore, this study was conducted to assess the baseline PF levels among school children in Lagos State, Nigeria. The secondary objective of the study was to investigate the associations of PF with cardiovascular, socio-demographic, and anthropometric variables.
2. Materials and Methods
Study design
This study was conducted using a quantitative cross-sectional design.
Participants
The study included 733 primary school learners, including 393 boys and 340 girls aged between 6 to 12 years out of the 744 participants who were originally recruited for this study. They were randomly selected from 40 public and private primary schools across Lagos State, Nigeria.
Sampling method and sample size
Non-probability purposive sampling method was used to recruit the participants. The sampling was performed with the parents and the child’s consent. Random number generators were used to select schools to have a mix of diverse socio-economic backgrounds after assigning codes to public and private schools. To determine the sample size, the cross-sectional study described by Charan and Biswas was used. The sample size was 384 people [21]. Table 1 presents the distribution of study participants according to the local government where their schools are located:
.jpg)
Inclusion and exclusion criteria
Primary schools children who are in the age range of 6-12 years were included in the study. Five children with lower limb deformities were excluded from this study because it did not allow them to cope with the physical demands of the study.
The modified maturity offset prediction equations validated by Koziel et al. were used to screen out individuals with early signs of puberty [22]. Six children were screened out from the target population using this formula.

Ethical considerations
The two bodies that provided ethical approvals for the study were the Biomedical Research Ethical Committee (BREC) of the University of KwaZulu-Natal (Reference number BREC/00000523/2019), and the Health Research Ethical Committee (HREC) of Lagos State University Teaching Hospital (Reference number LREC/06/10/1331). Gatekeepers’ permissions were also obtained from the head of the service and permanent secretary, the ministry of health, and the chairman of the State Universal Basic Education Board (SUBEB), Lagos State, Nigeria. According to the principle of non-maleficence, participants were prevented from sustaining any harm. The findings were kept confidential by the Declaration of Helsinki [23]. Pseudonyms were used when recording the findings [24].
Study data collection
After ethical approval and obtaining the gatekeeper’s permission, the informed consent form was given to the principals of the selected schools. The informed consent form was in English and Yoruba languages. The children were also informed that their participation is voluntary. Children who delivered the informed consent form were considered potential participants. Only eligible learners who volunteered to sign a partial assent form were finally included in the study after screening for any medical problems that can affect mobility. A biographical questionnaire was used to obtain variables, such as age, gender, and class of study.
Socio-economic status (SES)
The questions on the SES questionnaire were adopted from a similar instrument used by Gall et al. in South Africa [25]. The questionnaire items included household-level living standards, such as infrastructure and housing characteristics (type of home, number of bedrooms, type of toilet and access to indoor water, indoor toilet/bathroom, and electricity) and questions related to ownership of three durable assets (refrigerator, washing machine, and car). The dichotomized items (0 = poor quality, unavailable, 1 = high-quality, available) were summed to build an overall SES index, with higher scores reflecting higher SES.
Cardiovascular measures (blood pressure and heart rate)
A digital electronic blood pressure (BP) monitor (Samvine, USA) was used to measure children’s resting blood pressure and heart rate in a sitting position [26]. After five minutes of sitting at rest, five measurements were performed at two-minute intervals, and the last three measurements were averaged and used in the analysis [26].
Anthropometric Measurements: During the body weight measurements, the child stood on the scale for 5 s with feet hip-width apart. Body weight was measured to the nearest 0.1 kg. Before assessing the body weight at the beginning of each week, the weighing scale was calibrated using repeatability and eccentricity tests [27].
To measure the standing height (stature), the child stood with heels together and heels in contact with the base of the stadiometer. The body mass index (BMI) was calculated using the formula, BMI = Body weight/height2. Waist circumference was measured to the nearest 0.1 cm using an inelastic tape measure with the umbilicus as the reference point [28].
The same tape measure was used to measure the hip circumference (HC) with the most prominent point on the child’s hip as the reference point. The waist-hip ratio was calculated based on these values
Procedures for fitness measures
Physical fitness (PF) measures
PF measures were assessed using the battery test methods described by Armstrong and others [29].
Sit and reach (S&R) flexibility test: The child sat on the mat with legs extended and feet flexed on the back, with the soles of the foot on a special wooden box. The test was performed in such a way when the child was stretched forward with straight arms and tried to reach forward as far as possible. A research assistant held the legs to prevent them from bending. The height of the measuring box was 33 cm and a hanging 50 cm. The measurement was in centimeters and 15 cm was related to the child’s toes. The child performed the test twice, resulting in the highest reading (rounded to the next centimetre) recorded.
Standing long jump (SLJ): The child stood without shoes, knees bent, feet together, and arms behind the waist. The child waved his arms and jumped as far forward as possible, landing with feet together. Each child was allowed two times to attempt. The better score of the two was recorded as the test result. A child who lost balance during the test was given an additional opportunity. The score is measured in centimeters from the heels in the starting position to the point where the closest heel touched the ground after the jump.
Sit-ups (SU): The child was lying with the knees bent at 90°, feet flat on the ground, hands behind the head, and both shoulder blades on the floor. A research assistant sat in front of the child and kept the feet on the floor. The child sat down and touched both knees with the elbows, then returned to the starting position. This was repeated as much as possible for 30 s. If the elbows did not touch the knees, the shoulder blades did not touch the floor, or the hands were moved behind the head, the repetitions were recounted. The protocol requires that the feet remain on the ground during the test.
Five m shuttle run test (5 m SRT): Marker cones were placed 5 m apart. Two pieces of rope were placed along the ground at these points to indicate the start and finish lines of the 5 m distance. The child stayed behind the rope on one side of the shuttle. After counting 3, the child ran as fast as possible between the cones, crossed the line with both feet, then returned to the starting point. This task was repeated by each child to complete 10 shuttles (i.e., 50 m) in the shortest possible time. The time taken to complete 10 shuttles was recorded to the nearest 0.1 s. If children did not cross the line with both feet, they were penalized by 0.1 s. If this occurred more than once, they had to repeat the test after a short rest.
e) Cricket ball throw (CBT): In the cricket ball throwing test, the child has to throw a 135 g (0.135 kg) cricket ball as far as possible. A restraining line was identified. When throwing, the child had to stand in front of a marked restraining line. Children had to stay behind the second line marked at a distance of 2 m during the test. Running was possible even during follow-up, provided that the child remained within the specified 2-m area. Each child was allowed two times to attempt. The best throw was recorded as a score in meters.
Study data analysis
Statistical analyses were performed using the SPSS software version 27 (IBM, Armonk, NY, USA). Data cleaning procedures were performed to ensure the accuracy of the data. The data normality test using the Shapiro-Wilk test indicated that the data were not normally distributed; therefore, non-parametric tests were used to compare continuous variables. Frequency, percentage, median, and quartile were used for a descriptive summary of data.
To compare the median scores of sociodemographic, anthropometric, and cardiovascular variables of the participants based on gender, the Mann-Whitney U test was used. To control variables that were significantly different in the Mann-Whitney U test, Quade’s non-parametric analysis of covariance (ANCOVA) was computed to compare the median scores of PF scores (S&R, SLJ, SU, 5 m SRT, and CBT) based on gender. Spearman’s rank correlation coefficient was used to examine the relationship between PF and anthropometric and cardiovascular parameters and the socioeconomic index. Variables indicating a significant correlation with total PF were entered into the multivariate linear regression model to determine the predictors of low PF. The total fitness index was used as the dependent variable. The significance level was set at P<0.05.
3. Results
The participant included 733 primary school children aged 6-12 years. A total of 393 people (53.6%) were boys, and 340 people (46.4%) were girls in this study. Table 2 presents the comparison of anthropometric, cardiovascular, and sociodemographic variables by gender. The median age, BMI, height, weight, HC, waist circumference (WC), waist-hip ratio (WHR), socioeconomic status (SES), systolic blood pressure (SBP), and diastolic blood pressure (DBP) for both males and females were not significantly different from each other; however, the heart rate in girls was significantly (P=0.016) higher than in boys.
.jpg)
Table 3 presents the comparison of participants’ PF variables by gender using the non-parametric Quade ANCOVA.
.jpg)
The median values for SU (P<0.001), SLJ (P=0.008), CBT (P<0.001), and 5 m shuttle run (P=0.003) were significantly different from each other across gender, while median values for S and R for the two groups were not significantly different from each other.
Figure 1 depicts the baseline levels of PF among the participants recruited for the study. Low fitness was observed in 212 children, 28.9% of the children, 281 moderate children (38.3%), and finally 240 high children (32.7%).

The results in Table 4 show participants’ levels of PF compared to gender. The comparison of both boys and girls in the three levels of low, moderate, and high shows no significant difference.
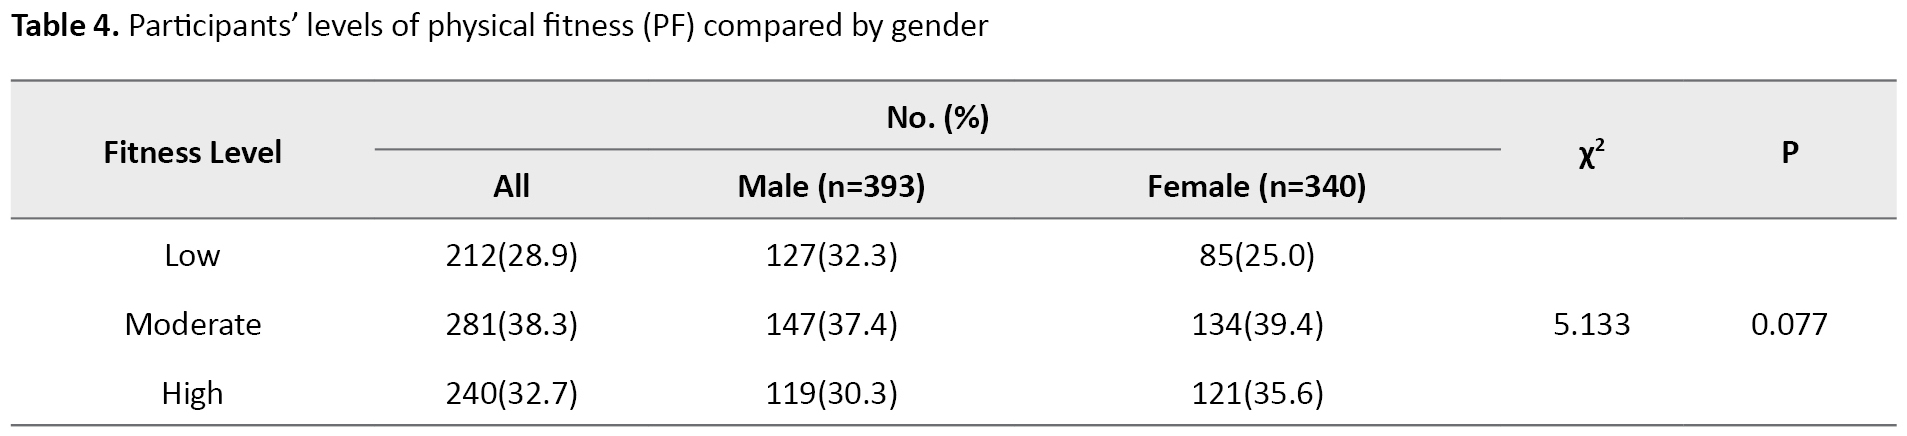
Table 5 presents the Spearman rank correlation for relationships between PF and each of the sociodemographic, anthropometric, and cardiovascular variables.

A negative correlation was observed between PF and each sex (r=-0.08, P=0.031), and WHR (r=-0.101, P=0.006) but a significant and positive correlation was observed between PF, and height (r=0.214, P<0.001), weight (r=0.153, P<0.001), HC (r=0.229, P<0.001), and WC (r=0.168, P<0.001), while no significant relationship was observed between PF and SES, SBP, age, BMI, DBP, and HR. Although the correlation was weak for all the variables.
Table 6 presents the multivariate linear regression for predictors of low fitness.
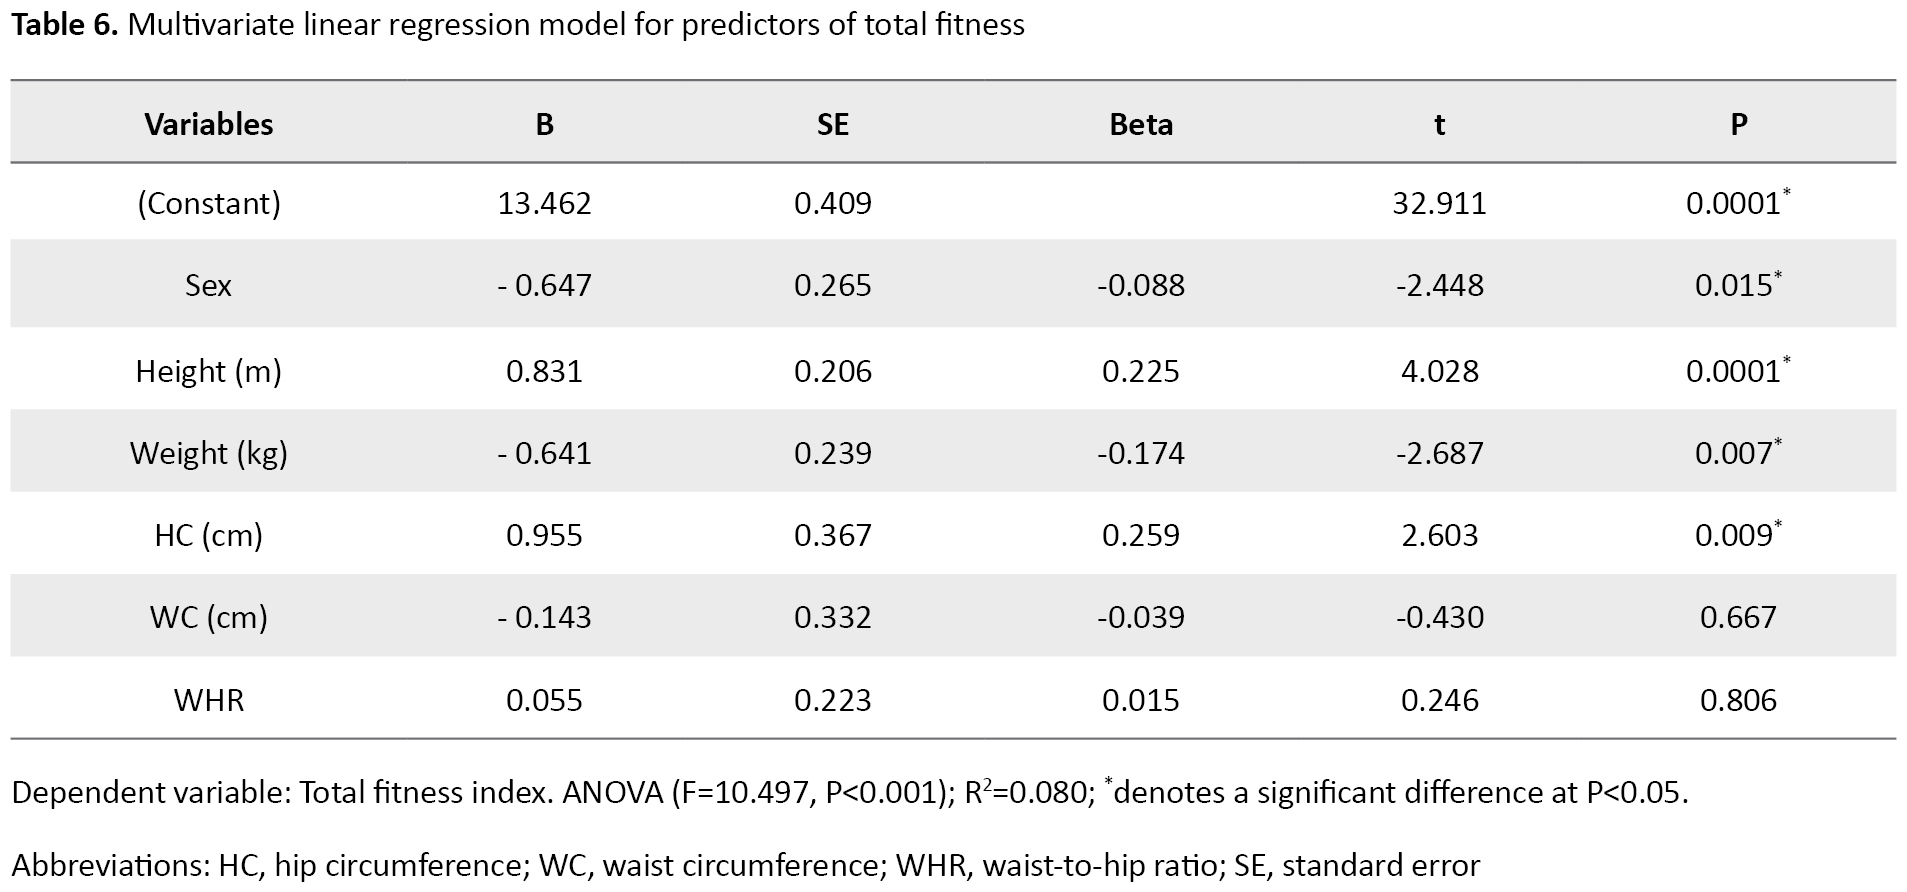
For the model, the analysis of variance (ANOVA) for the model was significant (F=10.497, P<0.001) and the model explained 8% of the total PF variances. The results showed that sex (B=0.647, P=0.015), height (B=0.831, P=0.000), weight (B=-0.641, P=0.007), and HC (B=0.955, P=0.009) were significantly associated with total PF (measured using S and R, SLJ, SU,5 m SRT, and CBT). A unit increase in height and HC increased total PF by 0.831 units and 0.955 units, respectively, while a unit increase in weight decreased total PF by 0.641 units.
4. Discussion
The main objective of this study was to describe the baseline PF data in primary school children in Lagos State, Nigeria. The secondary objective of the study was to examine the relationship of PF with anthropometric, sociodemographic, and cardiovascular parameters, to identify the predictors of low PF among this cohort of primary school children. Therefore, results from this study showed that the anthropometric, and sociodemographic variables were not significantly different between boys and girls. However, the heart rate was significantly higher in girls than in boys. This difference is probably due to the heart size, which could be because the smaller female heart, which pumps less blood with each beat, has to beat faster to match the larger male heart’s output [30].
The boys’ better performance regarding their SU, SLJ, and 50 m SRT scores is probable because girls tend to have less muscle mass than boys, so they cannot exert enough force when running and therefore it takes longer to complete the shuttle than boys [31]. The absolute differences in muscle strength differences between men and women have been extensively documented [32]. Men are known to have larger and stronger muscles than women [32, 33], with differences evident in upper-limb musculature [32]. This explains why the boys covered more distance in the cricket ball throw test, although there can be considerable overlap between the sexes [33]. The cross-sectional area (CSA) of the muscle or muscle groups, specific tension (force per unit cross-sectional area (CSA), which may be influenced by fiber type distribution and the amount of non-contractile tissue in the muscle), the subject’s ability to fully activate the motor units, and possible anatomical differences in the mechanical advantage of muscles acting across the body segments are all factors that predict a maximum voluntary strength. According to Maughan’s study [33], boys perform substantially better on all four fitness measures, in addition, the boy’s superiority in cardiorespiratory fitness is a consistent finding in the literature [34].
Also, no significant difference was observed between the levels of gender (low, moderate, or high). The levels of PF did not differ between the sexes because PF develops faster in boys than in girls only during puberty [35]. Therefore, no major differences were observed in boys and girls in any of the school and home activities to which they were exposed due to their pre-pubertal status. Guessogo and colleagues, in a Cameroonian study of pupils aged 10-15 years, found that boys outperformed girls in multiple tests using the Eurofit battery test [36].
The study’s findings revealed that PF is significantly correlated with sex, height, HC, WC, and WHR. Since gender differences, height, and weight are known correlates of PF [37]. In a survey of 14-year-old high school youths in South Africa, Monyeki and colleagues found that a strong and positive correlation between PF and BMI was found in girls with high fitness scores, while no significant relationship and weaker positive relationship between PF and BMI was found in boys with high fitness scores [38]. In another study, Dana and colleagues observed a positive relationship between PF and height and a negative correlation between PF and weight in a study comparing the anthropometrical and PF characteristics in 7-11-year-old urban and rural Iranian boys and girls [39].
The results of multivariate regression analysis identified gender, height, weight, and HC as predictors of PF in this age group. However, only gender and weight gain were associated with reduced PF. This may be due to gender differences in PF because boys are known to be more physically fit than girls. In a study on PF and anthropometric normative values among Colombian-Indian school children, Ramos-Sepulveda, and colleagues found that age had a significant effect on BMI and WC. Boys had significantly better cardiorespiratory fitness, and lower and upper limb strength than girls [40]. Although it seems logical that PF and weight gain are related, studies conducted on this association have yielded findings. In the Republic of Seychelles, the relationship between PF and overweight was found in a significant sample of school children, showing a strong inverse relationship between fitness and overweight [41]. In another study on the relationship between Body Mass Index and PF among Chinese University students, the findings of this study showed that any exercise evaluation test that was used (such as the standing long jump for explosive power or the distance run for cardiorespiratory endurance) was inversely correlated with BMI values regardless of gender [42].
Enhancing fitness in children may require specialized interventions that are sensitive to the capabilities and requirements of overweight youngsters, most likely through increasing physical activity.
5. Conclusion
This study showed that the predictors of low PF status in primary school children between 6 and 12 years were weight gain and gender. However, PF training should be encouraged by school health programs as part of health promotion activities included in the physical activity policy [43]. Moreover, this will help encourage children with poor PF to participate regularly in school health programs.
Weight loss program is encouraged to improve PF among the 6-12 year age group and to mitigate the health risks of overweight and obesity, stakeholders (government, health professionals, parents, and schools) in the Nigerian child welfare and public health sector should encourage and implement at least 60 minutes, and at most several hours of physical activity per day, ensure good nutrition and avoid bad feeding habits, such as overeating, reducing screen time, and increasing sleep for primary school children.
Limitations
The authors acknowledge certain limitations of this study. This is majorly a cross-sectional nature of the study since the direction of associations cannot be determined. It could not establish a cause-and-effect relationship. The lack of probability sampling in the recruitment strategy was another limitation.
Ethical Considerations
Compliance with ethical guidelines
This study was registered at clinical trials.gov with registration number NCT 04431115. The two bodies that provided ethical approvals for the study were the Biomedical Research Ethical Committee (BREC) of the University of KwaZulu-Natal (Reference No.: BREC/00000523/2019), and the Health Research Ethical Committee (HREC) of Lagos State University Teaching Hospital (Reference No.: LREC/06/10/1331).
Funding
The first author has received tuition remission as part of his doctoral studies and operating funding from the College of Health Sciences, University of KwaZulu- Natal, Durban, South Africa.
Authors contributions
Conceptualization: Olusegun Ojedoyin and Oladapo Olagbegi; Data curation: Olusegun Ojedoyin and Oladapo Olagbegi; Formal analysis: Oladapo Olagbegi; Funding acquisition: Thayananthee Nadasan and Pragashnie Govender; Methodology: Olusegun Ojedoyin, Oladapo Olagbegi, Thayananthee Nadasan, and Pragashnie Govender; Supervision: Oladapo Olagbegi, Thayananthee Nadasan and Pragashnie Govender; Writing–original draft: Olusegun Ojedoyin; Writing–review, and editing: Oladapo Olagbegi, Thayananthee Nadasan, and PragashnieGovender.
Conflict of interest
The authors declared no conflict of interest.
Acknowledgements
We are grateful to the University of KwaZulu-Natal, Durban, South Africa, for the fee remission funding for the first author, and also to the Lagos state government, Nigeria, for allowing us to recruit their students for this study.
References
Recent studies have shown a decline in physical fitness (PF) among children and adolescents in Africa and worldwide [1, 2]. This has resulted in an increased risk of poor cardiorespiratory fitness and an unexpected increase in cardiovascular morbidity and mortality [3]. Although most of these ailments appear with age, their origins can be traced back to infancy [4].
However, PF is defined as the ability to complete daily chores with vigor and alertness, without undue exhaustion, and with sufficient energy to enjoy leisure activities as well as to deal with unforeseen situations [3]. PF is influenced by a variety of quantitative factors. These include age, nutrition, and regular medical checkups [5]. Most components of fitness are divided into two categories, health-related and non-health-related. PF in early childhood is a powerful marker of health and can be divided into two broad categories, such as health-related fitness which includes aerobic fitness, muscular strength, muscular endurance, and flexibility, and skill-related fitness, including agility, balance, coordination, power, reaction time, and speed [5].
PF is essential to perform even a minimal level of activity without physical fatigue [6]. To perform daily activities without fatigue, it is necessary to be optimal in five areas of PF, which are cardiorespiratory endurance, muscular strength and endurance, flexibility, and body composition [7]. When we develop these areas as humans, our overall quality of life (QoL) will improve, lowering the risk of chronic diseases and eventually optimizing our health and well-being [8]. Cardiorespiratory endurance is the ability to perform prolonged, large-muscle, dynamic movements at a moderate to high level of intensity. This can mean the ability of your heart to pump blood and the ability of your lungs to efficiently receive oxygen [8].
Higher PF level is associated with higher levels of health-related quality of life (HRQoL) in elderly and chronically ill populations [9, 10]. However, prevention of risk factors, such as childhood obesity is effective through increased PF, which can enhance individuals’ mental and physical health [11, 12]. Lack of or reduced fitness causes children to lose the metabolic effect of fitness protecting them from excessive weight gain and metabolic diseases [13]. The report by Leppanen and colleagues further suggests that poor PF, inactive physical activity (PA), and increased risk of cardiovascular disease are all associated [14].
Moderate to vigorous physical activity (PA) is recommended to improve PF and thus prevent overweight and obesity in children [15]. PF is now recognized as a critical modern measure of childhood health and QoL. Better academic performance is associated with higher levels of fitness among primary school children [16].
In the recent past, the levels of activity have shifted significantly. Outdoor physical activity is rapidly supplemented by less physically demanding indoor activities [17]. Automobiles are used to transport students to school instead of cycling or walking. The number of people walking and participating in organized sports is decreasing [17]. The potential consequences of these alterations on children’s development and health have been a cause of concern to researchers and policymakers.
According to the United Nations, World population prospects, 43.8% of Nigeria’s population of 206 million were younger than 15 years in 2019 [18]. Every child has the right to life, which means that each child needs to be well-cared for to survive and develop normally. Childhood and adolescence are critical stages of life because they are marked by significant physiological and psychological changes. Similarly, during these years, a person’s lifestyle and healthy/unhealthy behaviours are formed, which may affect the behaviour and health status of adults [19].
PF is known to be influenced by environmental factors [20]. This suggests that, as active transportation reduces, the prevalence of noncommunicable diseases may rise unless adequate measures are taken, and that other anthropometric factors may affect PF.
However, African studies examining the prevalence of low PF levels, and their associations with cardiovascular, sociodemographic, and anthropometric factors in Nigerian school children are very scarce. Therefore, this study was conducted to assess the baseline PF levels among school children in Lagos State, Nigeria. The secondary objective of the study was to investigate the associations of PF with cardiovascular, socio-demographic, and anthropometric variables.
2. Materials and Methods
Study design
This study was conducted using a quantitative cross-sectional design.
Participants
The study included 733 primary school learners, including 393 boys and 340 girls aged between 6 to 12 years out of the 744 participants who were originally recruited for this study. They were randomly selected from 40 public and private primary schools across Lagos State, Nigeria.
Sampling method and sample size
Non-probability purposive sampling method was used to recruit the participants. The sampling was performed with the parents and the child’s consent. Random number generators were used to select schools to have a mix of diverse socio-economic backgrounds after assigning codes to public and private schools. To determine the sample size, the cross-sectional study described by Charan and Biswas was used. The sample size was 384 people [21]. Table 1 presents the distribution of study participants according to the local government where their schools are located:
Inclusion and exclusion criteria
Primary schools children who are in the age range of 6-12 years were included in the study. Five children with lower limb deformities were excluded from this study because it did not allow them to cope with the physical demands of the study.
The modified maturity offset prediction equations validated by Koziel et al. were used to screen out individuals with early signs of puberty [22]. Six children were screened out from the target population using this formula.
Ethical considerations
The two bodies that provided ethical approvals for the study were the Biomedical Research Ethical Committee (BREC) of the University of KwaZulu-Natal (Reference number BREC/00000523/2019), and the Health Research Ethical Committee (HREC) of Lagos State University Teaching Hospital (Reference number LREC/06/10/1331). Gatekeepers’ permissions were also obtained from the head of the service and permanent secretary, the ministry of health, and the chairman of the State Universal Basic Education Board (SUBEB), Lagos State, Nigeria. According to the principle of non-maleficence, participants were prevented from sustaining any harm. The findings were kept confidential by the Declaration of Helsinki [23]. Pseudonyms were used when recording the findings [24].
Study data collection
After ethical approval and obtaining the gatekeeper’s permission, the informed consent form was given to the principals of the selected schools. The informed consent form was in English and Yoruba languages. The children were also informed that their participation is voluntary. Children who delivered the informed consent form were considered potential participants. Only eligible learners who volunteered to sign a partial assent form were finally included in the study after screening for any medical problems that can affect mobility. A biographical questionnaire was used to obtain variables, such as age, gender, and class of study.
Socio-economic status (SES)
The questions on the SES questionnaire were adopted from a similar instrument used by Gall et al. in South Africa [25]. The questionnaire items included household-level living standards, such as infrastructure and housing characteristics (type of home, number of bedrooms, type of toilet and access to indoor water, indoor toilet/bathroom, and electricity) and questions related to ownership of three durable assets (refrigerator, washing machine, and car). The dichotomized items (0 = poor quality, unavailable, 1 = high-quality, available) were summed to build an overall SES index, with higher scores reflecting higher SES.
Cardiovascular measures (blood pressure and heart rate)
A digital electronic blood pressure (BP) monitor (Samvine, USA) was used to measure children’s resting blood pressure and heart rate in a sitting position [26]. After five minutes of sitting at rest, five measurements were performed at two-minute intervals, and the last three measurements were averaged and used in the analysis [26].
Anthropometric Measurements: During the body weight measurements, the child stood on the scale for 5 s with feet hip-width apart. Body weight was measured to the nearest 0.1 kg. Before assessing the body weight at the beginning of each week, the weighing scale was calibrated using repeatability and eccentricity tests [27].
To measure the standing height (stature), the child stood with heels together and heels in contact with the base of the stadiometer. The body mass index (BMI) was calculated using the formula, BMI = Body weight/height2. Waist circumference was measured to the nearest 0.1 cm using an inelastic tape measure with the umbilicus as the reference point [28].
The same tape measure was used to measure the hip circumference (HC) with the most prominent point on the child’s hip as the reference point. The waist-hip ratio was calculated based on these values
Procedures for fitness measures
Physical fitness (PF) measures
PF measures were assessed using the battery test methods described by Armstrong and others [29].
Sit and reach (S&R) flexibility test: The child sat on the mat with legs extended and feet flexed on the back, with the soles of the foot on a special wooden box. The test was performed in such a way when the child was stretched forward with straight arms and tried to reach forward as far as possible. A research assistant held the legs to prevent them from bending. The height of the measuring box was 33 cm and a hanging 50 cm. The measurement was in centimeters and 15 cm was related to the child’s toes. The child performed the test twice, resulting in the highest reading (rounded to the next centimetre) recorded.
Standing long jump (SLJ): The child stood without shoes, knees bent, feet together, and arms behind the waist. The child waved his arms and jumped as far forward as possible, landing with feet together. Each child was allowed two times to attempt. The better score of the two was recorded as the test result. A child who lost balance during the test was given an additional opportunity. The score is measured in centimeters from the heels in the starting position to the point where the closest heel touched the ground after the jump.
Sit-ups (SU): The child was lying with the knees bent at 90°, feet flat on the ground, hands behind the head, and both shoulder blades on the floor. A research assistant sat in front of the child and kept the feet on the floor. The child sat down and touched both knees with the elbows, then returned to the starting position. This was repeated as much as possible for 30 s. If the elbows did not touch the knees, the shoulder blades did not touch the floor, or the hands were moved behind the head, the repetitions were recounted. The protocol requires that the feet remain on the ground during the test.
Five m shuttle run test (5 m SRT): Marker cones were placed 5 m apart. Two pieces of rope were placed along the ground at these points to indicate the start and finish lines of the 5 m distance. The child stayed behind the rope on one side of the shuttle. After counting 3, the child ran as fast as possible between the cones, crossed the line with both feet, then returned to the starting point. This task was repeated by each child to complete 10 shuttles (i.e., 50 m) in the shortest possible time. The time taken to complete 10 shuttles was recorded to the nearest 0.1 s. If children did not cross the line with both feet, they were penalized by 0.1 s. If this occurred more than once, they had to repeat the test after a short rest.
e) Cricket ball throw (CBT): In the cricket ball throwing test, the child has to throw a 135 g (0.135 kg) cricket ball as far as possible. A restraining line was identified. When throwing, the child had to stand in front of a marked restraining line. Children had to stay behind the second line marked at a distance of 2 m during the test. Running was possible even during follow-up, provided that the child remained within the specified 2-m area. Each child was allowed two times to attempt. The best throw was recorded as a score in meters.
Study data analysis
Statistical analyses were performed using the SPSS software version 27 (IBM, Armonk, NY, USA). Data cleaning procedures were performed to ensure the accuracy of the data. The data normality test using the Shapiro-Wilk test indicated that the data were not normally distributed; therefore, non-parametric tests were used to compare continuous variables. Frequency, percentage, median, and quartile were used for a descriptive summary of data.
To compare the median scores of sociodemographic, anthropometric, and cardiovascular variables of the participants based on gender, the Mann-Whitney U test was used. To control variables that were significantly different in the Mann-Whitney U test, Quade’s non-parametric analysis of covariance (ANCOVA) was computed to compare the median scores of PF scores (S&R, SLJ, SU, 5 m SRT, and CBT) based on gender. Spearman’s rank correlation coefficient was used to examine the relationship between PF and anthropometric and cardiovascular parameters and the socioeconomic index. Variables indicating a significant correlation with total PF were entered into the multivariate linear regression model to determine the predictors of low PF. The total fitness index was used as the dependent variable. The significance level was set at P<0.05.
3. Results
The participant included 733 primary school children aged 6-12 years. A total of 393 people (53.6%) were boys, and 340 people (46.4%) were girls in this study. Table 2 presents the comparison of anthropometric, cardiovascular, and sociodemographic variables by gender. The median age, BMI, height, weight, HC, waist circumference (WC), waist-hip ratio (WHR), socioeconomic status (SES), systolic blood pressure (SBP), and diastolic blood pressure (DBP) for both males and females were not significantly different from each other; however, the heart rate in girls was significantly (P=0.016) higher than in boys.
Table 3 presents the comparison of participants’ PF variables by gender using the non-parametric Quade ANCOVA.
The median values for SU (P<0.001), SLJ (P=0.008), CBT (P<0.001), and 5 m shuttle run (P=0.003) were significantly different from each other across gender, while median values for S and R for the two groups were not significantly different from each other.
Figure 1 depicts the baseline levels of PF among the participants recruited for the study. Low fitness was observed in 212 children, 28.9% of the children, 281 moderate children (38.3%), and finally 240 high children (32.7%).
The results in Table 4 show participants’ levels of PF compared to gender. The comparison of both boys and girls in the three levels of low, moderate, and high shows no significant difference.
Table 5 presents the Spearman rank correlation for relationships between PF and each of the sociodemographic, anthropometric, and cardiovascular variables.
A negative correlation was observed between PF and each sex (r=-0.08, P=0.031), and WHR (r=-0.101, P=0.006) but a significant and positive correlation was observed between PF, and height (r=0.214, P<0.001), weight (r=0.153, P<0.001), HC (r=0.229, P<0.001), and WC (r=0.168, P<0.001), while no significant relationship was observed between PF and SES, SBP, age, BMI, DBP, and HR. Although the correlation was weak for all the variables.
Table 6 presents the multivariate linear regression for predictors of low fitness.
For the model, the analysis of variance (ANOVA) for the model was significant (F=10.497, P<0.001) and the model explained 8% of the total PF variances. The results showed that sex (B=0.647, P=0.015), height (B=0.831, P=0.000), weight (B=-0.641, P=0.007), and HC (B=0.955, P=0.009) were significantly associated with total PF (measured using S and R, SLJ, SU,5 m SRT, and CBT). A unit increase in height and HC increased total PF by 0.831 units and 0.955 units, respectively, while a unit increase in weight decreased total PF by 0.641 units.
4. Discussion
The main objective of this study was to describe the baseline PF data in primary school children in Lagos State, Nigeria. The secondary objective of the study was to examine the relationship of PF with anthropometric, sociodemographic, and cardiovascular parameters, to identify the predictors of low PF among this cohort of primary school children. Therefore, results from this study showed that the anthropometric, and sociodemographic variables were not significantly different between boys and girls. However, the heart rate was significantly higher in girls than in boys. This difference is probably due to the heart size, which could be because the smaller female heart, which pumps less blood with each beat, has to beat faster to match the larger male heart’s output [30].
The boys’ better performance regarding their SU, SLJ, and 50 m SRT scores is probable because girls tend to have less muscle mass than boys, so they cannot exert enough force when running and therefore it takes longer to complete the shuttle than boys [31]. The absolute differences in muscle strength differences between men and women have been extensively documented [32]. Men are known to have larger and stronger muscles than women [32, 33], with differences evident in upper-limb musculature [32]. This explains why the boys covered more distance in the cricket ball throw test, although there can be considerable overlap between the sexes [33]. The cross-sectional area (CSA) of the muscle or muscle groups, specific tension (force per unit cross-sectional area (CSA), which may be influenced by fiber type distribution and the amount of non-contractile tissue in the muscle), the subject’s ability to fully activate the motor units, and possible anatomical differences in the mechanical advantage of muscles acting across the body segments are all factors that predict a maximum voluntary strength. According to Maughan’s study [33], boys perform substantially better on all four fitness measures, in addition, the boy’s superiority in cardiorespiratory fitness is a consistent finding in the literature [34].
Also, no significant difference was observed between the levels of gender (low, moderate, or high). The levels of PF did not differ between the sexes because PF develops faster in boys than in girls only during puberty [35]. Therefore, no major differences were observed in boys and girls in any of the school and home activities to which they were exposed due to their pre-pubertal status. Guessogo and colleagues, in a Cameroonian study of pupils aged 10-15 years, found that boys outperformed girls in multiple tests using the Eurofit battery test [36].
The study’s findings revealed that PF is significantly correlated with sex, height, HC, WC, and WHR. Since gender differences, height, and weight are known correlates of PF [37]. In a survey of 14-year-old high school youths in South Africa, Monyeki and colleagues found that a strong and positive correlation between PF and BMI was found in girls with high fitness scores, while no significant relationship and weaker positive relationship between PF and BMI was found in boys with high fitness scores [38]. In another study, Dana and colleagues observed a positive relationship between PF and height and a negative correlation between PF and weight in a study comparing the anthropometrical and PF characteristics in 7-11-year-old urban and rural Iranian boys and girls [39].
The results of multivariate regression analysis identified gender, height, weight, and HC as predictors of PF in this age group. However, only gender and weight gain were associated with reduced PF. This may be due to gender differences in PF because boys are known to be more physically fit than girls. In a study on PF and anthropometric normative values among Colombian-Indian school children, Ramos-Sepulveda, and colleagues found that age had a significant effect on BMI and WC. Boys had significantly better cardiorespiratory fitness, and lower and upper limb strength than girls [40]. Although it seems logical that PF and weight gain are related, studies conducted on this association have yielded findings. In the Republic of Seychelles, the relationship between PF and overweight was found in a significant sample of school children, showing a strong inverse relationship between fitness and overweight [41]. In another study on the relationship between Body Mass Index and PF among Chinese University students, the findings of this study showed that any exercise evaluation test that was used (such as the standing long jump for explosive power or the distance run for cardiorespiratory endurance) was inversely correlated with BMI values regardless of gender [42].
Enhancing fitness in children may require specialized interventions that are sensitive to the capabilities and requirements of overweight youngsters, most likely through increasing physical activity.
5. Conclusion
This study showed that the predictors of low PF status in primary school children between 6 and 12 years were weight gain and gender. However, PF training should be encouraged by school health programs as part of health promotion activities included in the physical activity policy [43]. Moreover, this will help encourage children with poor PF to participate regularly in school health programs.
Weight loss program is encouraged to improve PF among the 6-12 year age group and to mitigate the health risks of overweight and obesity, stakeholders (government, health professionals, parents, and schools) in the Nigerian child welfare and public health sector should encourage and implement at least 60 minutes, and at most several hours of physical activity per day, ensure good nutrition and avoid bad feeding habits, such as overeating, reducing screen time, and increasing sleep for primary school children.
Limitations
The authors acknowledge certain limitations of this study. This is majorly a cross-sectional nature of the study since the direction of associations cannot be determined. It could not establish a cause-and-effect relationship. The lack of probability sampling in the recruitment strategy was another limitation.
Ethical Considerations
Compliance with ethical guidelines
This study was registered at clinical trials.gov with registration number NCT 04431115. The two bodies that provided ethical approvals for the study were the Biomedical Research Ethical Committee (BREC) of the University of KwaZulu-Natal (Reference No.: BREC/00000523/2019), and the Health Research Ethical Committee (HREC) of Lagos State University Teaching Hospital (Reference No.: LREC/06/10/1331).
Funding
The first author has received tuition remission as part of his doctoral studies and operating funding from the College of Health Sciences, University of KwaZulu- Natal, Durban, South Africa.
Authors contributions
Conceptualization: Olusegun Ojedoyin and Oladapo Olagbegi; Data curation: Olusegun Ojedoyin and Oladapo Olagbegi; Formal analysis: Oladapo Olagbegi; Funding acquisition: Thayananthee Nadasan and Pragashnie Govender; Methodology: Olusegun Ojedoyin, Oladapo Olagbegi, Thayananthee Nadasan, and Pragashnie Govender; Supervision: Oladapo Olagbegi, Thayananthee Nadasan and Pragashnie Govender; Writing–original draft: Olusegun Ojedoyin; Writing–review, and editing: Oladapo Olagbegi, Thayananthee Nadasan, and PragashnieGovender.
Conflict of interest
The authors declared no conflict of interest.
Acknowledgements
We are grateful to the University of KwaZulu-Natal, Durban, South Africa, for the fee remission funding for the first author, and also to the Lagos state government, Nigeria, for allowing us to recruit their students for this study.
References
- Olagbegi OM, Nadasan T, Mazibuko Y, Mfenga E, Rangana K, Themba R. Physical fitness profile of rural versus urban primary school children in eThekwini district, KwaZulu-Natal, South Africa. Human Movement. 2022; 23(3):140-9. [DOI:10.5114/hm.2022.107974]
- Masanovic B, Gardasevic J, Marques A, Peralta M, Demetriou Y, Sturm DJ, et al. Trends in physical fitness among school-aged children and adolescents: A systematic review. Frontiers in Pediatrics. 2020; 8:627529. [DOI:10.3389/fped.2020.627529] [PMID] [PMCID]
- Huang CP, Chen WL. Relevance of physical fitness and cardiovascular disease risk. Circulation Journal. 2021; 85(5):623-30. [DOI:10.1253/circj.CJ-20-0510] [PMID]
- Secchi JD, García GC, España-Romero V, Castro-Piñero J. Condición física y riesgo cardiovascular futuro en niños y adolescentes argentinos: una introducción de la batería ALPHA. Archivos Argentinos de Pediatría. 2014; 112(2):132-40. [DOI:10.5546/aap.2014.eng.132] [PMCID]
- Raghuveer G, Hartz J, Lubans DR, Takken T, Wiltz JL, Mietus-Snyder M, et al. Cardiorespiratory fitness in youth: An important marker of health: A scientific statement From the American Heart Association. Circulation. 2020; 142(7):e101-18. [DOI:10.1161/CIR.0000000000000866] [PMID] [PMCID]
- Pate R, Oria M, Pillsbury L. Committee on fitness measures and health outcomes in youth. Washington (DC): National Academies Press (US); 2012. [Link]
- Tremblay MS, Shields M, Laviolette M, Craig CL, Janssen I, Gorber SC. Fitness of Canadian children and youth: Results from the 2007-2009 Canadian Health Measures Survey. Health Reports. 2010; 21(1):7-20. [PMID]
- Jellum L, Flynn S, Howard J, Moser A, Mathis D, Collins C, et al. Nursing and health sciences open textbooks. In: Henderson S, editor. Concepts of fitness and wellness. Georgia: University System of Georgia; 2018. [Link]
- Rejeski WJ, Spring B, Domanchuk K, Tao H, Tian L, Zhao L, et al. A group-mediated, home-based physical activity intervention for patients with peripheral artery disease: Effects on social and psychological function. Journal of Translational Medicine. 2014; 12:29. [DOI:10.1186/1479-5876-12-29] [PMID] [PMCID]
- Dedieu N, Fernández L, Garrido-Lestache E, Sánchez I, Lamas MJ. Effects of a cardiac rehabilitation program in patients with congenital heart disease. Open Journal of Internal Medicine. 2014; 4(1):22-7. [DOI:10.4236/ojim.2014.41004]
- Morales PF, Sánchez-López M, Moya-Martínez P, García-Prieto JC, Martínez-Andrés M, García NL, et al. Health-related quality of life, obesity, and fitness in schoolchildren: The Cuenca study. Quality of Life Research. 2013; 22(7):1515-23.[DOI:10.1007/s11136-012-0282-8] [PMID]
- Ströhle A. Physical activity, exercise, depression and anxiety disorders. Journal of Neural Transmission. 2009; 116(6):777-84. [DOI:10.1007/s00702-008-0092-x] [PMID]
- Bürgi F, Meyer U, Granacher U, Schindler C, Marques-Vidal P, Kriemler S, et al. Relationship of physical activity with motor skills, aerobic fitness and body fat in preschool children: A cross-sectional and longitudinal study (Ballabeina). International Journal of Obesity. 2011; 35(7):937-44. [DOI:10.1038/ijo.2011.54] [PMID]
- Leppänen MH, Ray C, Wennman H, Alexandrou C, Sääksjärvi K, Koivusilta L, et al. Compliance with the 24-h movement guidelines and the relationship with anthropometry in Finnish preschoolers: The DAGIS study. BMC Public Health. 2019; 19(1):1618. [DOI:10.1186/s12889-019-7967-7] [PMID] [PMCID]
- Strasser B. Physical activity in obesity and metabolic syndrome. Annals of the New York Academy of Sciences. 2013; 1281(1):141-59. [DOI:10.1111/j.1749-6632.2012.06785.x] [PMID] [PMCID]
- Fonseca F, Valley J, Cowboy M, Orr S, Llorente F. Physical fitness as an indicator of health status and its relatinalship to academic performance during the prepuberal period. Health Promotion Perspectives. 2017;7(4):197-204. [DOI:10.15171/hpp.2017.35] [PMID] [PMCID]
- Fjørtoft I, Pedersen AV, Sigmundsson H, Vereijken B. Measuring physical fitness in children who are 5 to 12 years old with a test battery that is functional and easy to administer. Physical Therapy. 2011; 91(7):1087-95. [DOI:10.2522/ptj.20090350] [PMID]
- Department of Economic and Social Affairs Population Division. World population prospects 2022. New York: United Nation; 2022. [Link]
- Ruiz JR, Ortega FB, Gutierrez A, Meusel D, Sjöström M, Castillo MJ. Health-related fitness assessment in childhood and adolescence: A European approach based on the AVENA, EYHS and HELENA studies. Journal of Public Health. 2006; 14(5):269-77. [DOI:10.1007/s10389-006-0059-z]
- Rúa-Alonso M, Rial-Vázquez J, Nine I, Lete-Lasa JR, Clavel I, Giráldez-García MA, et al. Comparison of physical fitness profiles obtained before and during COVID-19 pandemic in two independent large samples of children and adolescents: DAFIS project. International Journal of Environmental Research and Public Health. 2022; 19(7):3963. [DOI:10.3390/ijerph19073963] [PMID] [PMCID]
- Charan J, Biswas T. How to calculate sample size for different study designs in medical research? Indian Journal of Psychological Medicine. 2013; 35(2):121-6. [DOI:10.4103/0253-7176.116232] [PMID] [PMCID]
- Kozieł SM, Malina RM. Modified maturity offset prediction equations: Validation in independent longitudinal samples of boys and girls. Sports Medicine. 2018; 48(1):221-36. [DOI:10.1007/s40279-017-0750-y] [PMID] [PMCID]
- Krleža-Jerić K, Lemmens T. 7th revision of the Declaration of Helsinki: Good news for the transparency of clinical trials. Croatian Medical Journal. 2009; 50(2):105-10. [DOI:10.3325/cmj.2009.50.105] [PMID] [PMCID]
- Saunders B, Kitzinger J, Kitzinger C. Anonymising interview data: Challenges and compromise in practice. Qualitative Research. 2015; 15(5):616-32. [DOI:10.1177/1468794114550439] [PMID] [PMCID]
- Gall S, Müller I, Walter C, Seelig H, Steenkamp L, Pühse U, et al. Associations between selective attention and soil-transmitted helminth infections, socioeconomic status, and physical fitness in disadvantaged children in Port Elizabeth, South Africa: An observational study. PLoS Neglected Tropical Diseases. 2017; 11(5):e0005573. [DOI:10.1371/journal.pntd.0005573] [PMID] [PMCID]
- Chambers LW, Kaczorowski J, O’Rielly S, Ignagni S, Hearps SJ. Comparison of blood pressure measurements using an automated blood pressure device in community pharmacies and family physicians’ offices: A randomized controlled trial. Canadian Medical Association Open Access Journal. 2013; 1(1):E37-42. [DOI:10.9778/cmajo.20130005] [PMID] [PMCID]
- National Health And Nutrition Examination Survey III: Body measurements (Anthropometry). Maryland: Westat, Inc; 1988. [Link]
- WHO. Waist circumference and waist-hip ratio: Report of a WHO expert consultation, 2008 December 8-11. Geneva: World Health Organization; 2011. [Link]
- Armstrong N, Tomkinson G, Ekelund U. Aerobic fitness and its relationship to sport, exercise training and habitual physical activity during youth. British Journal of Sports Medicine. 2011; 45(11):849-58. [DOI:10.1136/bjsports-2011-090200] [PMID]
- Punita P, Saranya K, Kumar SS. Gender difference in heart rate variability in medical students and association with the level of stress. National Journal of Physiology, Pharmacy and Pharmacology. 1970; 6(5):431-7. [DOI:10.5455/njppp.2016.6.0102325042016]
- Glenmark B, Nilsson M, Gao H, Gustafsson JA, Dahlman-Wright K, Westerblad H. Difference in skeletal muscle function in males vs. females: role of estrogen receptor-β. American Journal of Physiology-Endocrinology and Metabolism. 2004; 287(6):E1125-31. [DOI:10.1152/ajpendo.00098.2004] [PMID]
- Courtright SH, McCormick BW, Postlethwaite BE, Reeves CJ, Mount MK. A meta-analysis of sex differences in physical ability: Revised estimates and strategies for reducing differences in selection contexts. Journal of Applied Psychology. 2013; 98(4):623-41. [DOI:10.1037/a0033144] [PMID]
- Kavanagh JJ, Smith KA, Minahan CL. Sex differences in muscle activity emerge during sustained low-intensity contractions but not during intermittent low-intensity contractions. Physiological Reports. 2020; 8(7):e14398. [DOI:10.14814/phy2.14398] [PMID] [PMCID]
- Ostojic SM, Stojanovic MD, Stojanovic V, Maric J, Njaradi N. Correlation between fitness and fatness in 6-14-year old Serbian school children. Journal of Health, Population, and Nutrition. 2011; 29(1):53-60. [DOI:10.3329/jhpn.v29i1.7566] [PMID] [PMCID]
- Marceau K, Ram N, Houts RM, Grimm KJ, Susman EJ. Individual differences in boys' and girls' timing and tempo of puberty: Modeling development with nonlinear growth models. Developmental Psychology. 2011; 47(5):1389-409. [DOI:10.1037/a0023838] [PMID] [PMCID]
- Guessogo WR, Mekoulou Ndongo J, Assomo-Ndemba PB, Hamadou A, Biassi O, Tsobgny-Panka C, et al. Gender differences in physical fitness among cameroonian school children aged 10 to 15 years in yaounde city. International Journal of School Health. 2020; 7(3):45-54. [DOI:10.30476/intjsh.2020.86621.1086]
- Aboshkair KA, Amri SB, Yee KL, Samah B. Factors affecting levels of health-related physical fitness in sSecondary school students in Selangor, Malaysia. Journal of Basic & Applied Sciences. 2012; 8(1):202-16. [DOI:10.6000/1927-5129.2012.08.01.32]
- Monyeki MA, Neetens R, Moss SJ, Twisk J. The relationship between body composition and physical fitness in 14 year old adolescents residing within the Tlokwe local municipality, South Africa: The PAHL study. BMC Public Health. 2012; 12:374. [DOI:10.1186/1471-2458-12-374] [PMID] [PMCID]
- Dana A, Abad A, Branch K, Habibi Z, Hashemi M, Asghari A. A description and comparison of anthropometrical and physical fitness characteristics in urban and rural 7-11 years old boys and girls in Golestan Province, Iran. Middle-East Journal of Scientific Research. 2011; 7(6):826-32. [DOI:10.2139/ssrn.3947479]
- Ramos-Sepúlveda JA, Ramírez-Vélez R, Correa-Bautista JE, Izquierdo M, García-Hermoso A. Physical fitness and anthropometric normative values among Colombian-Indian schoolchildren. BMC public health. 2016; 16(1):962. [DOI:10.1186/s12889-016-3652-2] [PMID] [PMCID]
- Bovet P, Auguste R, Burdette H. Strong inverse association between physical fitness and overweight in adolescents: A large school-based survey. International Journal of Behavioral Nutrition and Physical Activity. 2007; 4:24. [DOI:10.1186/1479-5868-4-24] [PMID] [PMCID]
- Ding C, Jiang Y. The relationship between body mass index and physical fitness among chinese university students: Results of a longitudinal study. Healthcare. 2020; 8(4):570. [DOI:10.3390/healthcare8040570] [PMID] [PMCID]
- Oldridge-Turner K, Kokkorou M, Sing F, Klepp KI, Rutter H, Helleve A, et al. Promoting physical activity policy: The development of the MOVING framework. Journal of Physical Activity and Health. 2022; 19(4):292-315. [DOI:10.1123/jpah.2021-0732] [PMID]
Type of Study: Original Article |
Subject:
Health Education
Send email to the article author
| Rights and permissions | |
 |
This work is licensed under a Creative Commons Attribution-NonCommercial 4.0 International License. |
