

Volume 12, Issue 1 (Winter 2024)
Iran J Health Sci 2024, 12(1): 39-48 |
Back to browse issues page


Ethics code: IR.MUMS.REC.1400.248
Clinical trials code: Not Applicable
Download citation:
BibTeX | RIS | EndNote | Medlars | ProCite | Reference Manager | RefWorks
Send citation to:


BibTeX | RIS | EndNote | Medlars | ProCite | Reference Manager | RefWorks
Send citation to:
Talkhi N, Akbari Sharak N, Yousefi R, Salari M, Sadati S M, Shakeri M T. Predicting COVID-19 Mortality and Identifying Clinical Symptom Patterns in Hospitalized Patients: A Machine-learning Study. Iran J Health Sci 2024; 12 (1) :39-48
URL: http://jhs.mazums.ac.ir/article-1-875-en.html
URL: http://jhs.mazums.ac.ir/article-1-875-en.html
Nasrin Talkhi 

 , Nooshin Akbari Sharak , Razieh Yousefi , Maryam Salari , Seyed Masoud Sadati , Mohammad Taghi Shakeri *
, Nooshin Akbari Sharak , Razieh Yousefi , Maryam Salari , Seyed Masoud Sadati , Mohammad Taghi Shakeri *
Social Determinants of Health Research Center, Mashhad University of Medical Sciences, Mashhad, Iran. , ShakeriMT@mums.ac.ir
Keywords: Machine learning, SARS-CoV-2, COVID-19 diagnostic testing, Logistic regression, Neural network
Full-Text [PDF 1029 kb]
(600 Downloads)
| Abstract (HTML) (1811 Views)
Full-Text: (574 Views)
Introduction
In December 2019, a novel coronavirus was identified in Wuhan, Hubei Province, China [1, 2]. Due to the virus’s high transmissibility, it quickly spread globally, resulting in a pandemic that significantly impacted daily life. The World Health Organization (WHO) has reported that the virus has now affected all countries, disrupting personal life, economy, and industry [3]. The first case of COVID-19 in Iran was confirmed to be PCR-positive on February 19, 2020, following the pandemic’s spread to various regions worldwide [4].
According to research, the virus can remain viable on surfaces from several hours to a few days and spread rapidly from person to person [5]. Common symptoms of the infection include fatigue, weakness, chest pain, difficulty breathing, sore throat, fever, muscular pain, and acute respiratory distress, although some individuals may be asymptomatic [5, 6]. The mortality rate for high-risk groups, such as older people and those with preexisting conditions such as cardiovascular disease, diabetes, chronic respiratory disease, and hypertension, is notably higher than in healthy individuals [7]. There are four classifications of COVID-19: mild, moderate, severe, and critical. However, most infected individuals present with mild symptoms [8]. Early virus detection is crucial in ceasing its transmission and preventing complications and spread. Thus, timely diagnosis and treatment are crucial to controlling the disease [8].
Governments have implemented various interventions and strategies, such as maintaining social distancing, wearing masks, staying at home, and avoiding large gatherings to limit the spread of the pandemic [9]. Despite these efforts and several years of dealing with the disease, it continues to cause fatalities in many individuals [10]. Moreover, due to the virus’s wide distribution, genetic recombination is possible, leading to the emergence of new coronavirus strains. Therefore, it is likely that this infectious disease will periodically resurface in humans [1].
In the current scenario, data analysts should use statistical, mathematical, and machine learning (ML) models to predict and diagnose fatalities. Providing earlier warnings to governments and policymakers about potential deaths can aid in making informed decisions. Statistical techniques and ML algorithms have widely been used in the medical field with successful outcomes [11, 12]. Studies have shown that methods such as artificial neural networks (ANN) and logistic regression (LR) can assist in disease diagnosis [13-16].
In this study, our objective was to examine the behavioral patterns of SARS-CoV-2 through LR and ANN. By analyzing these models, we could identify factors closely linked to the death status of individuals affected by the virus. We also assessed the significance of certain characteristics on the likelihood of dying from the virus. Based on these factors, we used this data to model and predict the disease mortality rate.
Materials and Methods
Study design and data collection
This retrospective study focused on hospitalized COVID-19 patients between February 20, 2021, and September 12, 2021, in Khorasan Razavi Province, northeast Iran (Figure 1).
 The study investigated various aspects of this patient population and employed a retrospective design. The study population comprised individuals admitted to hospitals within Khorasan Razavi Province due to COVID-19 symptoms. Patients were included based on their doctor’s diagnosis and the necessity for hospitalization. The study focused on patients with positive polymerase chain reaction (PCR) test for COVID-19.
Sampling was conducted from the comprehensive records available in the Medical Care Monitoring Center (MCMC) database. The database contained data extracted from questionnaires filled out by nurses during patient care. The inclusion criteria consisted of individuals with confirmed COVID-19 diagnosis through PCR testing. It is important to note that Khorasan Razavi Province is a religious center that welcomes pilgrims from various parts of Iran and neighboring Muslim countries. Before analysis, a meticulous data-cleaning process was undertaken. The data were thoroughly reviewed to identify and remove inaccuracies, irrelevant entries, missing information, and incomplete records. As a result, a dataset comprising 23 variables and 26867 instances was compiled for subsequent analyses.
The independent variables in this study were demographic information, epidemiological data, and clinical symptoms. These variables include age, sex, fever, cough, muscular pain, respiratory distress, decreased consciousness, decreased sense of smell, reduced sense of taste, convulsions, headache, confusion, chest pain, skin inflammation, stomachache, nausea, vomiting, diarrhea, anorexia, smoking status, drug use, PO2, cancer, chronic liver diseases, diabetes, chronic blood diseases, immunodeficiency, heart diseases, chronic kidney diseases, asthma, chronic neurological disorders, hypertension. The dependent variable, death status, was dichotomous with survivor or non-survivor status.
Statistical analysis
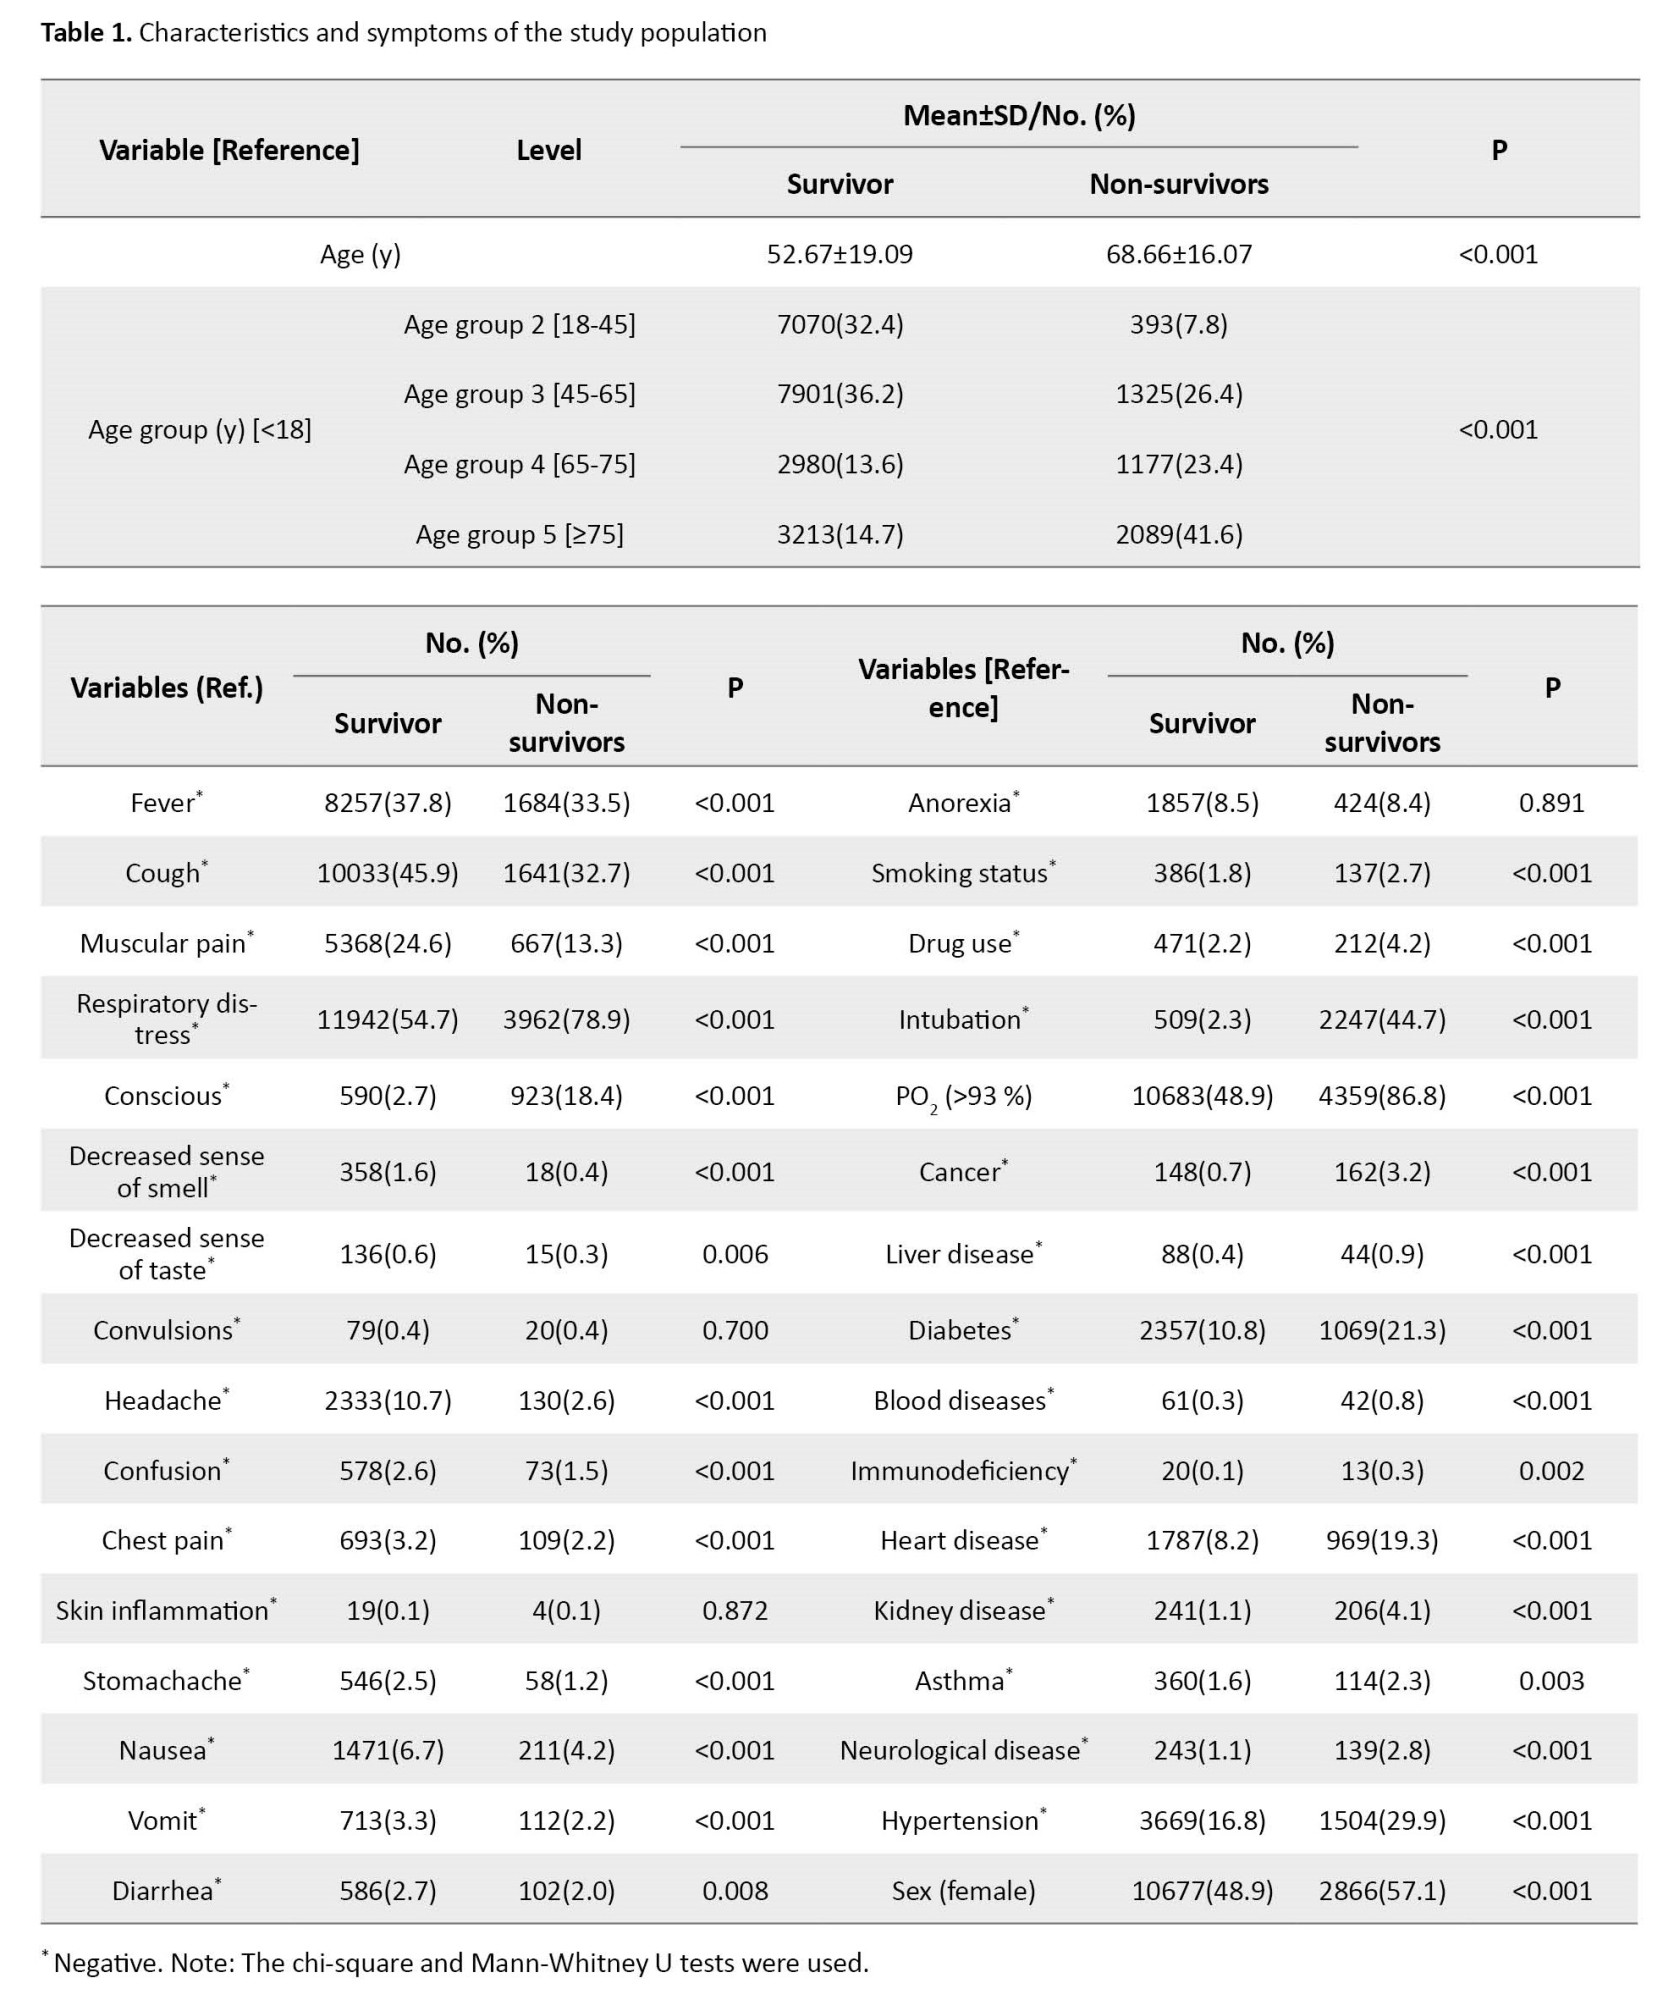
To perform statistical and primary analysis in this study, the R software version 4.1.1 was used. All the analyses were performed in the PCR+ individuals. The descriptive statistics for age were reported as Mean±SD. The Kolmogorov-Smirnov test was used to check the normality of the age variable. The normality test showed that the age was distributed as normal. The Mean±SD death age in PCR+ individuals was 68.66±16.07 years. The age variable was categorized based on available information about age categories according to the WHO [17]. The Mann-Whitney U-test was applied to compare the mean age between two independent groups (survivor/non-survivor).
A body temperature higher than 37°C was considered to be a fever. The chi-square test was used to investigate the association between death status and qualitative variables. A P<0.05 was regarded as statistically significant.
Mortality modeling
LR is an appropriate statistical regression [18, 19, 20]. Recently, it has been commonly used in the medical and biological sciences [21]. The LR model is more popular than other methods among medical researchers because the exponentiated slope coefficient in the LR model can be interpreted as an odds ratio (OR) [22, 23]. The Hosmer-Lemeshow goodness of fit (GOF) test, Cox & Snell R2, and Nagelkerke R2 for the LR model were calculated. P>0.05 in Hosmer-Lemeshow GOF indicated a good fit for the model.
ANN has been one of the branches of artificial intelligence since the 1990s, with numerous applications in medical diagnosis. ANN models try to find a connection between the input and output data. In other words, they attempt to act similarly to the human brain. Also, ANN is an advanced intelligent tool for researchers and medical diagnosis fields such as cancer, heart diseases, hepatitis, and drug development [24]. To train and optimize an ANN model, the 10-fold cross-validation (CV) method was used in which 90% of records were randomly assigned to training data for constructing the models and the remaining 10% to testing data to evaluate the model’s performance. The performance of the ANN and LR classifiers was assessed by the confusion matrix and the related performance evaluation criteria, such as sensitivity, specificity, accuracy, precision, and recall, as follows (Equations 1 and 2):
, Where TP, FN, FP, and TN are true positive, false negative, false positive, and true negative, respectively [25-27]. In the end, a lollipop plot was used to depict the importance of predictor variables in the LR and ANN models.
Results
Descriptive statistics for the observed symptoms, underlying diseases, and other characteristics of the studied COVID-19 patients are reported in Table 1.
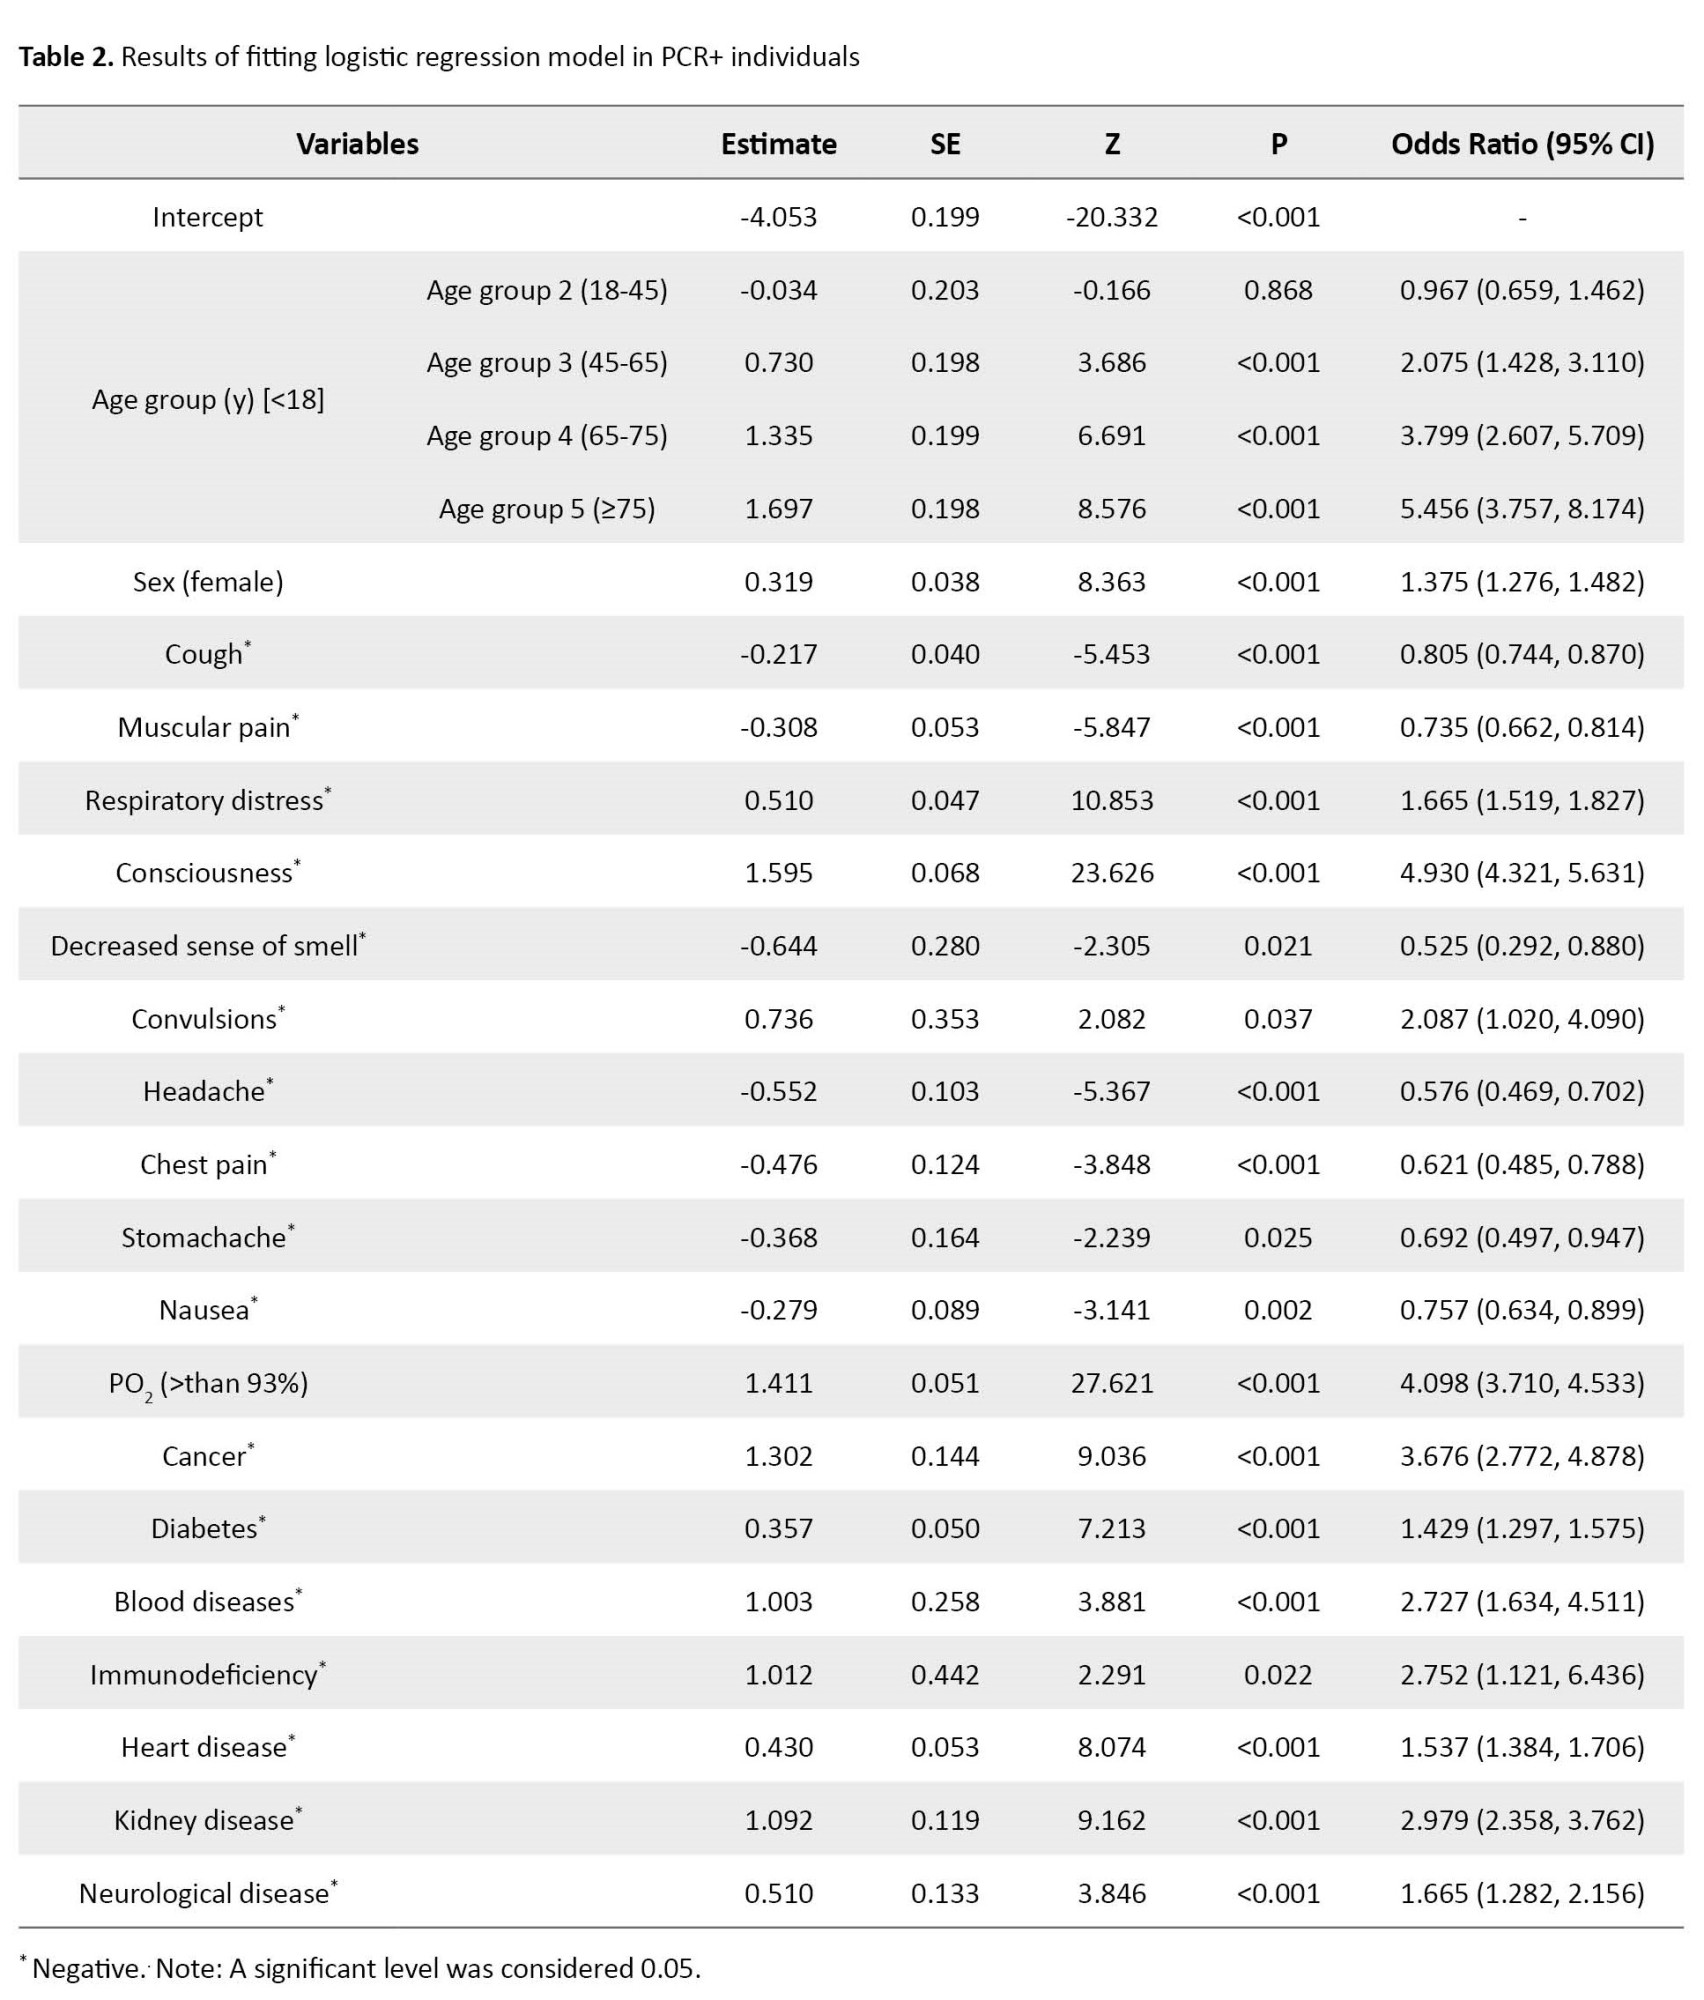
The results of the LR model are shown in Table 2.
The Hosmer-Lemeshow GOF P, Cox & Snell R2, and Nagelkerke R2 for PCR+ individuals were obtained as 0.657, 0.646, and 0.892, respectively. The Pseudo R2 (Cox & Snell and Nagelkerke) indicated a strong relationship between the predictors and the target variables. To achieve the optimal LR model, the non-significant predictors were removed from the model based on the highest P. The remaining variables in the model were significant at the error level of 0.05. The obtained P>0.05 in the Hosmer-Lemeshow GOF indicated that the LR model is reliable. Accordingly, individuals over 75 had the highest effect in classifying the survivor and non-survivor with an OR equal to 5.45 [95% CI, 3.75%-8.17%]. After that, the consciousness status and PO2<93% had high OR equal to 4.93 [4.32, 5.63] and 4.09 [3.71, 4.53], respectively. Cancer and age groups between 65 and 75 had an OR larger than 3. In addition, some variables such as chronic blood diseases, immunodeficiency, and chronic kidney diseases were identified as risk factors for mortality with OR larger than 2. More details are shown in Table 2.
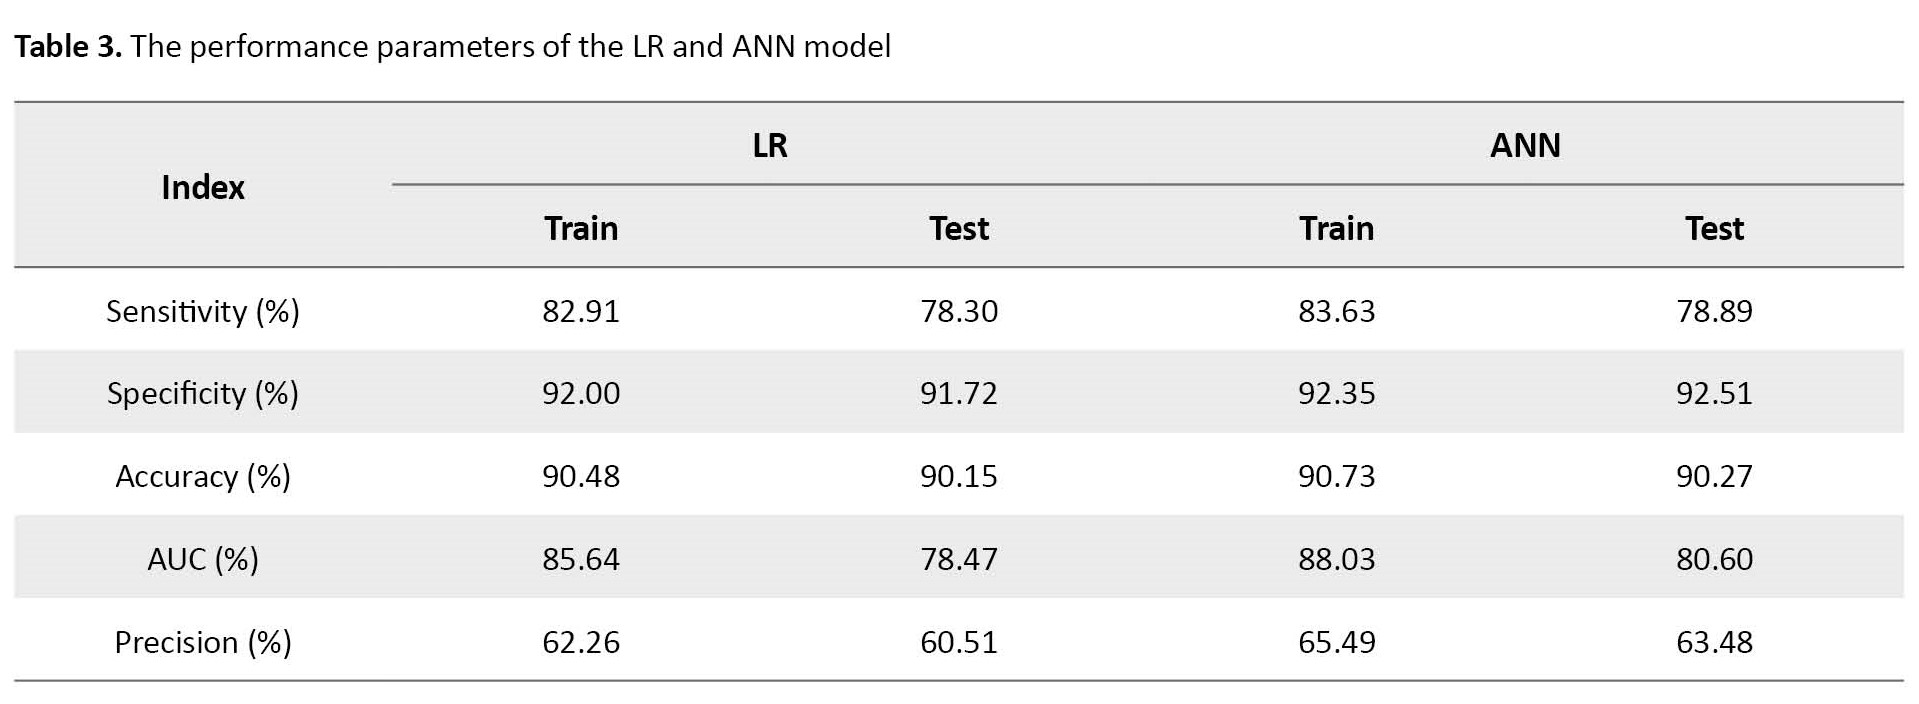
The extracted evaluation indices or classification metrics are sensitivity, specificity, area under the curve (AUC), recall, and precision (Table 3).
In the prediction step, the accuracy of classification in the LR model was calculated at 90.15%.
The ANN model was trained with the entry of all studied predictor variables. Hyperparameters are size (hidden units) and decay (weight decay). Tuning range of and were used to choose the optimal values of size and decay, respectively. The decay weight and size were obtained at 0.4 and 3, respectively. In the optimization process, the number of iterations for converging the model was considered 100.
As Table 3 indicates, the accuracy of the fitted ANN model was 90.27%. The sensitivity of the ANN classifier on test data was 78.89%. The analyses of the training ANN model showed that the ANN model also had a high classification ability. Furthermore, the relative importance of independent variables in the ANN model was also computed and graphically shown in Figure 2-B.
 In addition, the architecture of the developed network can be seen in Figure 2-A.
Decreasing consciousness, cough, PO2, age, chronic kidney disease, fever, headache, smoking status, chronic blood diseases, and diarrhea are the 10 most important predictors of death using the ANN model.
Discussion
The primary objective of this study was to employ ANN and LR methods to predict the mortality risk associated with COVID-19 in Khorasan Razavi Province, Iran. Our analysis covered data from 26867 individuals, considering 23 variables, including demographic characteristics, symptoms, and underlying health conditions. The predictive models were evaluated based on sensitivity, specificity, AUC, recall, precision, and accuracy. The Hosmer-Lemeshow goodness of fit test confirmed the reliability of the LR model, showcasing its robustness in predicting patient outcomes.
Our findings demonstrated that the ANN and LR models could predict and classify patients effectively, though the ANN model outperforms the LR model. Remarkably, attributes such as decreased consciousness, cough, PO2 levels, and age emerged as critical indicators in the ANN models. Among underlying health conditions, cancer, blood diseases, kidney diseases, and neurological diseases held the highest significance. Surprisingly, fever, a common symptom of COVID-19, did not prove to be a substantial predictor, demonstrating minimal influence in distinguishing survivors from non-survivors. Similarly, variables such as asthma decreased taste sensation and sex, and individuals aged 18 to 45 showed relatively limited importance in classification.
A relevant study by Mohammadi et al. in Iran employed similar ANN and LR methods for COVID-19 patient diagnosis, corroborating our findings of the superior accuracy of ANN over LR in diagnostics. While they identified fever, cough, shortness of breath, fatigue, chills, and headache as common symptoms, only cough and headache aligned with our observations. Contrasts were also noted in prevalent underlying conditions: hypertension, diabetes, chronic obstructive pulmonary disease, and coronary heart disease in their study versus cancer, chronic kidney diseases, chronic blood diseases, and chronic neurological diseases [28]. Kanday et al. employed LR and multinomial Naive Bayes classifier approaches to detect COVID-19 and grouped clinical reports into various classes. Their study achieved remarkable accuracy (96.2%) with machine learning techniques, showcasing the potential of these methods in disease classification [29]. Wang et al. utilized logistic models and machine learning techniques to predict the COVID-19 epidemic’s trajectory, underlining the versatility of machine learning in addressing multifaceted pandemic dynamics [30]. Similarly, Shaban et al. employed fuzzy inference engines and deep neural networks to detect COVID-19 infection, contributing to the expanding array of machine-learning applications [31]. Numerous other studies have used ANN and machine learning to forecast COVID-19 prevalence, mortality rates, new cases, and deaths, further confirming the consistency and applicability of our machine-learning approach [32-38].
Conclusion
The current paper’s findings have presented the importance of some demographics, underlying diseases, and clinical symptoms in classifying survivors vs non-survivors of COVID-19 disease in one of the biggest provinces of Iran, namely Khorasan Razavi. The findings showed that decreasing consciousness, cough, PO2, and age were the most important characteristics in ANN models to predict mortality. The most common and significant underlying diseases were cancer, blood disease, kidney disease, and neurological disease. Although fever is one of the most common symptoms of COVID-19, it was not a significant predictor or an influential factor in classifying survivors vs non-survivors. Having asthma, decreased taste sense, sex, and age between 18 to 45 years had the least importance and contribution in classifying survivors vs non-survivors. Chronic blood diseases, immunodeficiency, and chronic kidney diseases were identified as risk factors for mortality. In the end, we hope our results help the medical community.
Study limitations
Due to the elusive nature of the disease, its symptoms were subject to continuous evolution, with some variables added to the database at a later stage. Notably, gastrointestinal symptoms represent one such example. Another limitation is the study population, which is limited to hospitalized patients. The information collected related to underlying diseases relied on self-reporting from the individuals, thus introducing potential bias into the data.
Ethical Considerations
Compliance with ethical guidelines
The study was approved by the Ethics Committee of the Mashhad University of Medical Sciences in 2021 (Code: IR.MUMS.REC.1400.248).
Funding
This research did not receive any grant from funding agencies in the public, commercial, or non-profit sectors.
Authors contributions
Conceptualization, methodology, formal analysis and software: Nasrin Talkhi; Investigation: Nooshin Akbari Sharak; Data curation: Maryam Salari; Data management: Seyed Masoud Sadati; Writing the original draft: Nasrin Talkhi and Nooshin Akbari Sharak; Review and editing: Nooshin Akbari Sharak and Razieh Yousefi; Supervision and validation: Mohammad Taghi Shakeri.
Conflict of interest
The authors declared no conflict of interest.
Acknowledgements
The authors would like to acknowledge and thank all the experts who participated in the study.
References
In December 2019, a novel coronavirus was identified in Wuhan, Hubei Province, China [1, 2]. Due to the virus’s high transmissibility, it quickly spread globally, resulting in a pandemic that significantly impacted daily life. The World Health Organization (WHO) has reported that the virus has now affected all countries, disrupting personal life, economy, and industry [3]. The first case of COVID-19 in Iran was confirmed to be PCR-positive on February 19, 2020, following the pandemic’s spread to various regions worldwide [4].
According to research, the virus can remain viable on surfaces from several hours to a few days and spread rapidly from person to person [5]. Common symptoms of the infection include fatigue, weakness, chest pain, difficulty breathing, sore throat, fever, muscular pain, and acute respiratory distress, although some individuals may be asymptomatic [5, 6]. The mortality rate for high-risk groups, such as older people and those with preexisting conditions such as cardiovascular disease, diabetes, chronic respiratory disease, and hypertension, is notably higher than in healthy individuals [7]. There are four classifications of COVID-19: mild, moderate, severe, and critical. However, most infected individuals present with mild symptoms [8]. Early virus detection is crucial in ceasing its transmission and preventing complications and spread. Thus, timely diagnosis and treatment are crucial to controlling the disease [8].
Governments have implemented various interventions and strategies, such as maintaining social distancing, wearing masks, staying at home, and avoiding large gatherings to limit the spread of the pandemic [9]. Despite these efforts and several years of dealing with the disease, it continues to cause fatalities in many individuals [10]. Moreover, due to the virus’s wide distribution, genetic recombination is possible, leading to the emergence of new coronavirus strains. Therefore, it is likely that this infectious disease will periodically resurface in humans [1].
In the current scenario, data analysts should use statistical, mathematical, and machine learning (ML) models to predict and diagnose fatalities. Providing earlier warnings to governments and policymakers about potential deaths can aid in making informed decisions. Statistical techniques and ML algorithms have widely been used in the medical field with successful outcomes [11, 12]. Studies have shown that methods such as artificial neural networks (ANN) and logistic regression (LR) can assist in disease diagnosis [13-16].
In this study, our objective was to examine the behavioral patterns of SARS-CoV-2 through LR and ANN. By analyzing these models, we could identify factors closely linked to the death status of individuals affected by the virus. We also assessed the significance of certain characteristics on the likelihood of dying from the virus. Based on these factors, we used this data to model and predict the disease mortality rate.
Materials and Methods
Study design and data collection
This retrospective study focused on hospitalized COVID-19 patients between February 20, 2021, and September 12, 2021, in Khorasan Razavi Province, northeast Iran (Figure 1).
Sampling was conducted from the comprehensive records available in the Medical Care Monitoring Center (MCMC) database. The database contained data extracted from questionnaires filled out by nurses during patient care. The inclusion criteria consisted of individuals with confirmed COVID-19 diagnosis through PCR testing. It is important to note that Khorasan Razavi Province is a religious center that welcomes pilgrims from various parts of Iran and neighboring Muslim countries. Before analysis, a meticulous data-cleaning process was undertaken. The data were thoroughly reviewed to identify and remove inaccuracies, irrelevant entries, missing information, and incomplete records. As a result, a dataset comprising 23 variables and 26867 instances was compiled for subsequent analyses.
The independent variables in this study were demographic information, epidemiological data, and clinical symptoms. These variables include age, sex, fever, cough, muscular pain, respiratory distress, decreased consciousness, decreased sense of smell, reduced sense of taste, convulsions, headache, confusion, chest pain, skin inflammation, stomachache, nausea, vomiting, diarrhea, anorexia, smoking status, drug use, PO2, cancer, chronic liver diseases, diabetes, chronic blood diseases, immunodeficiency, heart diseases, chronic kidney diseases, asthma, chronic neurological disorders, hypertension. The dependent variable, death status, was dichotomous with survivor or non-survivor status.
Statistical analysis
To perform statistical and primary analysis in this study, the R software version 4.1.1 was used. All the analyses were performed in the PCR+ individuals. The descriptive statistics for age were reported as Mean±SD. The Kolmogorov-Smirnov test was used to check the normality of the age variable. The normality test showed that the age was distributed as normal. The Mean±SD death age in PCR+ individuals was 68.66±16.07 years. The age variable was categorized based on available information about age categories according to the WHO [17]. The Mann-Whitney U-test was applied to compare the mean age between two independent groups (survivor/non-survivor).
A body temperature higher than 37°C was considered to be a fever. The chi-square test was used to investigate the association between death status and qualitative variables. A P<0.05 was regarded as statistically significant.
Mortality modeling
LR is an appropriate statistical regression [18, 19, 20]. Recently, it has been commonly used in the medical and biological sciences [21]. The LR model is more popular than other methods among medical researchers because the exponentiated slope coefficient in the LR model can be interpreted as an odds ratio (OR) [22, 23]. The Hosmer-Lemeshow goodness of fit (GOF) test, Cox & Snell R2, and Nagelkerke R2 for the LR model were calculated. P>0.05 in Hosmer-Lemeshow GOF indicated a good fit for the model.
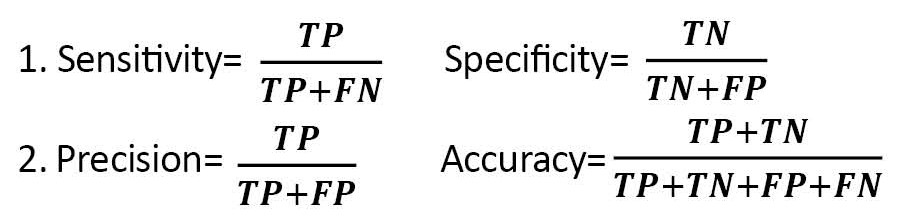
ANN has been one of the branches of artificial intelligence since the 1990s, with numerous applications in medical diagnosis. ANN models try to find a connection between the input and output data. In other words, they attempt to act similarly to the human brain. Also, ANN is an advanced intelligent tool for researchers and medical diagnosis fields such as cancer, heart diseases, hepatitis, and drug development [24]. To train and optimize an ANN model, the 10-fold cross-validation (CV) method was used in which 90% of records were randomly assigned to training data for constructing the models and the remaining 10% to testing data to evaluate the model’s performance. The performance of the ANN and LR classifiers was assessed by the confusion matrix and the related performance evaluation criteria, such as sensitivity, specificity, accuracy, precision, and recall, as follows (Equations 1 and 2):
, Where TP, FN, FP, and TN are true positive, false negative, false positive, and true negative, respectively [25-27]. In the end, a lollipop plot was used to depict the importance of predictor variables in the LR and ANN models.
Results
Descriptive statistics for the observed symptoms, underlying diseases, and other characteristics of the studied COVID-19 patients are reported in Table 1.
The results of the LR model are shown in Table 2.
The Hosmer-Lemeshow GOF P, Cox & Snell R2, and Nagelkerke R2 for PCR+ individuals were obtained as 0.657, 0.646, and 0.892, respectively. The Pseudo R2 (Cox & Snell and Nagelkerke) indicated a strong relationship between the predictors and the target variables. To achieve the optimal LR model, the non-significant predictors were removed from the model based on the highest P. The remaining variables in the model were significant at the error level of 0.05. The obtained P>0.05 in the Hosmer-Lemeshow GOF indicated that the LR model is reliable. Accordingly, individuals over 75 had the highest effect in classifying the survivor and non-survivor with an OR equal to 5.45 [95% CI, 3.75%-8.17%]. After that, the consciousness status and PO2<93% had high OR equal to 4.93 [4.32, 5.63] and 4.09 [3.71, 4.53], respectively. Cancer and age groups between 65 and 75 had an OR larger than 3. In addition, some variables such as chronic blood diseases, immunodeficiency, and chronic kidney diseases were identified as risk factors for mortality with OR larger than 2. More details are shown in Table 2.
The extracted evaluation indices or classification metrics are sensitivity, specificity, area under the curve (AUC), recall, and precision (Table 3).
In the prediction step, the accuracy of classification in the LR model was calculated at 90.15%.
The ANN model was trained with the entry of all studied predictor variables. Hyperparameters are size (hidden units) and decay (weight decay). Tuning range of and were used to choose the optimal values of size and decay, respectively. The decay weight and size were obtained at 0.4 and 3, respectively. In the optimization process, the number of iterations for converging the model was considered 100.
As Table 3 indicates, the accuracy of the fitted ANN model was 90.27%. The sensitivity of the ANN classifier on test data was 78.89%. The analyses of the training ANN model showed that the ANN model also had a high classification ability. Furthermore, the relative importance of independent variables in the ANN model was also computed and graphically shown in Figure 2-B.
Decreasing consciousness, cough, PO2, age, chronic kidney disease, fever, headache, smoking status, chronic blood diseases, and diarrhea are the 10 most important predictors of death using the ANN model.
Discussion
The primary objective of this study was to employ ANN and LR methods to predict the mortality risk associated with COVID-19 in Khorasan Razavi Province, Iran. Our analysis covered data from 26867 individuals, considering 23 variables, including demographic characteristics, symptoms, and underlying health conditions. The predictive models were evaluated based on sensitivity, specificity, AUC, recall, precision, and accuracy. The Hosmer-Lemeshow goodness of fit test confirmed the reliability of the LR model, showcasing its robustness in predicting patient outcomes.
Our findings demonstrated that the ANN and LR models could predict and classify patients effectively, though the ANN model outperforms the LR model. Remarkably, attributes such as decreased consciousness, cough, PO2 levels, and age emerged as critical indicators in the ANN models. Among underlying health conditions, cancer, blood diseases, kidney diseases, and neurological diseases held the highest significance. Surprisingly, fever, a common symptom of COVID-19, did not prove to be a substantial predictor, demonstrating minimal influence in distinguishing survivors from non-survivors. Similarly, variables such as asthma decreased taste sensation and sex, and individuals aged 18 to 45 showed relatively limited importance in classification.
A relevant study by Mohammadi et al. in Iran employed similar ANN and LR methods for COVID-19 patient diagnosis, corroborating our findings of the superior accuracy of ANN over LR in diagnostics. While they identified fever, cough, shortness of breath, fatigue, chills, and headache as common symptoms, only cough and headache aligned with our observations. Contrasts were also noted in prevalent underlying conditions: hypertension, diabetes, chronic obstructive pulmonary disease, and coronary heart disease in their study versus cancer, chronic kidney diseases, chronic blood diseases, and chronic neurological diseases [28]. Kanday et al. employed LR and multinomial Naive Bayes classifier approaches to detect COVID-19 and grouped clinical reports into various classes. Their study achieved remarkable accuracy (96.2%) with machine learning techniques, showcasing the potential of these methods in disease classification [29]. Wang et al. utilized logistic models and machine learning techniques to predict the COVID-19 epidemic’s trajectory, underlining the versatility of machine learning in addressing multifaceted pandemic dynamics [30]. Similarly, Shaban et al. employed fuzzy inference engines and deep neural networks to detect COVID-19 infection, contributing to the expanding array of machine-learning applications [31]. Numerous other studies have used ANN and machine learning to forecast COVID-19 prevalence, mortality rates, new cases, and deaths, further confirming the consistency and applicability of our machine-learning approach [32-38].
Conclusion
The current paper’s findings have presented the importance of some demographics, underlying diseases, and clinical symptoms in classifying survivors vs non-survivors of COVID-19 disease in one of the biggest provinces of Iran, namely Khorasan Razavi. The findings showed that decreasing consciousness, cough, PO2, and age were the most important characteristics in ANN models to predict mortality. The most common and significant underlying diseases were cancer, blood disease, kidney disease, and neurological disease. Although fever is one of the most common symptoms of COVID-19, it was not a significant predictor or an influential factor in classifying survivors vs non-survivors. Having asthma, decreased taste sense, sex, and age between 18 to 45 years had the least importance and contribution in classifying survivors vs non-survivors. Chronic blood diseases, immunodeficiency, and chronic kidney diseases were identified as risk factors for mortality. In the end, we hope our results help the medical community.
Study limitations
Due to the elusive nature of the disease, its symptoms were subject to continuous evolution, with some variables added to the database at a later stage. Notably, gastrointestinal symptoms represent one such example. Another limitation is the study population, which is limited to hospitalized patients. The information collected related to underlying diseases relied on self-reporting from the individuals, thus introducing potential bias into the data.
Ethical Considerations
Compliance with ethical guidelines
The study was approved by the Ethics Committee of the Mashhad University of Medical Sciences in 2021 (Code: IR.MUMS.REC.1400.248).
Funding
This research did not receive any grant from funding agencies in the public, commercial, or non-profit sectors.
Authors contributions
Conceptualization, methodology, formal analysis and software: Nasrin Talkhi; Investigation: Nooshin Akbari Sharak; Data curation: Maryam Salari; Data management: Seyed Masoud Sadati; Writing the original draft: Nasrin Talkhi and Nooshin Akbari Sharak; Review and editing: Nooshin Akbari Sharak and Razieh Yousefi; Supervision and validation: Mohammad Taghi Shakeri.
Conflict of interest
The authors declared no conflict of interest.
Acknowledgements
The authors would like to acknowledge and thank all the experts who participated in the study.
References
- Zhu N, Zhang D, Wang W, Li X, Yang B, Song J, et al. A novel coronavirus from patients with pneumonia in China, 2019. The New England Journal of Medicine. 2020; 382(8):727-33. [DOI:10.1056/NEJMoa2001017] [PMID]
- Esfahanian F, SeyedAlinaghi S A, Janfaza N, Tantuoyir M M. Prevalence of hypothyroidism among patients with covid-19 in Tehran City, Iran. Iranian Journal of Health Sciences. 2023; 11(2):87-92. [DOI:10.32598/ijhs.11.2.942.1]
- Brem A, Viardot E, Nylund PA. Implications of the coronavirus (COVID-19) outbreak for innovation: Which technologies will improve our lives? Technological Forecasting and Social Change. 2021; 163:120451. [DOI:10.1016/j.techfore.2020.120451] [PMID]
- Abdi M. Coronavirus disease 2019 (COVID-19) outbreak in Iran: Actions and problems. Infection Control & Hospital Epidemiology. 2020; 41(6):754-5. [DOI:10.1017/ice.2020.86] [PMID]
- Yadav M, Perumal M, Srinivas M. Analysis on novel coronavirus (COVID-19) using machine learning methods. Chaos, Solitons & Fractals. 2020; 139:110050. [DOI:10.1016/j.chaos.2020.110050] [PMID]
- Pontoh RS, Solichatus Z, Hidayat Y, Aldella R, Mahardika Jiwani N, Sukono. Covid-19 modelling in South Korea using A Time Series Approach. International Journal of Advanced Science and Technology. 2020; 29(7):1620 -32. [Link]
- Mohammadzadeh Rostami F, Nasr Esfahani BN, Ahadi AM, Shalibeik S. A review of novel coronavirus, severe acute respiratory syndrome coronavirus 2 (sars-cov-2). Iranian Journal of Medical Microbiology. 2020; 14(2):154-61. [DOI:10.30699/ijmm.14.2.154]
- Wu Z, Huang Z, Wu Y, Jin Y, Wang Y, Zhao H, et al. Risk stratification for mortality in cardiovascular disease survivors: A survival conditional inference tree analysis. Nutrition, Metabolism & Cardiovascular Diseases. 2021; 31(2):420-8. [DOI:10.1016/j.numecd.2020.09.029] [PMID]
- Belhadi A, Kamble S, Jabbour CJC, Gunasekaran A, Ndubisi NO, Venkatesh M. Manufacturing and service supply chain resilience to the COVID-19 outbreak: Lessons learned from the automobile and airline industries. Technological Forecasting and Social Change. 2021; 163:120447. [DOI:10.1016/j.techfore.2020.120447] [PMID]
- Ballı S. Data analysis of Covid-19 pandemic and short-term cumulative case forecasting using machine learning time series methods. Chaos, Solitons, and Fractals. 2021; 142:110512. [DOI:10.1016/j.chaos.2020.110512] [PMID]
- Srinivas M, Lin YY, Liao HYM. Deep dictionary learning for fine-grained image classification. Paper presented at: 2017 IEEE International Conference on Image Processing (ICIP). 17-20 September 2017; Beijing, China. [DOI:10.1109/ICIP.2017.8296398]
- Rabie AH, Saleh AI, Mansour NA. A Covid-19’s integrated herd immunity (CIHI) based on classifying people vulnerability. Computers in Biology and Medicine. 2022; 140:105112. [DOI:10.1016/j.compbiomed.2021.105112] [PMID]
- Ing EB, Miller NR, Nguyen A, Su W, Bursztyn LLCD, Poole M, et al. Neural network and logistic regression diagnostic prediction models for giant cell arteritis: Development and validation. Clinical Ophthalmology (Auckland, NZ). 2019; 13:421-30. [DOI:10.2147/OPTH.S193460] [PMID]
- Gour M, Jain S. Stacked convolutional neural network for diagnosis of covid-19 disease from X-ray images. Preprint from arXiv. 2020. [Link]
- Battineni G, Sagaro GG, Chinatalapudi N, Amenta F. Applications of machine learning predictive models in the chronic disease diagnosis. Journal of Personalized Medicine. 2020; 10(2):21. [DOI:10.3390/jpm10020021] [PMID]
- Selvi RT, Muthulakshmi I. An optimal artificial neural network based big data application for heart disease diagnosis and classification model. Journal of Ambient Intelligence and Humanized Computing.2021; 12(6):6129-39. [DOI:10.1007/s12652-020-02181-x]
- Worldometers. Age, sex, existing conditions of covid-19 cases and deaths [Internet]. 2020 [Updated 13 May 2020]. Available from: [Link]
- Hosmer Jr DW, Lemeshow S, Sturdivant RX. Applied logistic regression. New Jersey: John Wiley & Sons; 2013. [DOI:10.1002/9781118548387]
- Yee TW. Categorical Data Analysis. In: Yee TW, editor. Vector generalized linear and additive models. New York: Springer; 2015. [DOI:10.1007/978-1-4939-2818-7_14]
- Brydon H, Blignaut R, Jacobs J. A weighted bootstrap approach to logistic regression modelling in identifying risk behaviours associated with sexual activity. SAHARA: Journal of Social Aspects of HIV/AIDS Research Alliance. 2019; 16(1):62-9. [DOI:10.1080/17290376.2019.1636708] [PMID]
- Swaminathan S. Logistic regression - detailed overview. 2018. Towards Data Science. 2018; 1-3. [Link]
- Schober P, Vetter TR. Logistic regression in medical research. Anesthesia and Analgesia. 2021; 132(2):365-6. [DOI:10.1213/ANE.0000000000005247] [PMID]
- Bagley SC, White H, Golomb BA. Logistic regression in the medical literature: Standards for use and reporting, with particular attention to one medical domain. Journal of Clinical Epidemiology. 2001; 54(10):979-85. [DOI:10.1016/S0895-4356(01)00372-9] [PMID]
- Moein S. Artificial Neural Network for Medical Diagnosis. In: Medical Diagnosis Using Artificial Neural Networks. Hershey, PA: IGI Global; 2014. [DOI:10.4018/978-1-4666-6146-2.ch007]
- Nellore SB. Various performance measures in Binary classification-An Overview of ROC study. IJISET-International Journal of Innovative Science, Engineering & Technology. 2015; 2(9):596-605. [Link]
- Tong Z, Liu Y, Ma H, Zhang J, Lin B, Bao X, et al. Development, validation and comparison of artificial neural network models and logistic regression models predicting survival of unresectable pancreatic cancer. Frontiers in Bioengineering and Biotechnology. 2020; 8:196. [DOI:10.3389/fbioe.2020.00196] [PMID]
- Fawcett T. An introduction to ROC analysis. Pattern Recognition Letters. 2006; 27(8):861-74. [DOI:10.1016/j.patrec.2005.10.010]
- Mohammadi F, Pourzamani H, Karimi H, Mohammadi M, Mohammadi M, Ardalan N, et al. Artificial neural network and logistic regression modelling to characterize COVID-19 infected patients in local areas of Iran. Biomedical Journal. 2021; 44(3):304-16. [DOI:10.1016/j.bj.2021.02.006] [PMID]
- Khanday AMUD, Rabani ST, Khan QR, Rouf N, Mohi Ud Din M. Machine learning based approaches for detecting COVID-19 using clinical text data. International Journal of Information Technology. 2020; 12(3):731-9. [DOI:10.1007/s41870-020-00495-9] [PMID]
- Wang P, Zheng X, Li J, Zhu B. Prediction of epidemic trends in COVID-19 with logistic model and machine learning technics. Chaos, Solitons & Fractals. 2020; 139:110058. [DOI:10.1016/j.chaos.2020.110058] [PMID]
- Shaban WM, Rabie AH, Saleh AI, Abo-Elsoud MA. Detecting COVID-19 patients based on fuzzy inference engine and Deep Neural Network. Applied Soft Computing. 2021; 99:106906.[DOI:10.1016/j.asoc.2020.106906] [PMID]
- Toğa G, Atalay B, Toksari MD. COVID-19 prevalence forecasting using Autoregressive Integrated Moving Average (ARIMA) and Artificial Neural Networks (ANN): Case of Turkey. Journal of Infection and Public Health. 2021; 14(7):811-6. [DOI:10.1016/j.jiph.2021.04.015] [PMID]
- Hasan N. A methodological approach for predicting COVID-19 epidemic using EEMD-ANN hybrid model. Internet of Things. 2020; 11:100228. [DOI:10.1016/j.iot.2020.100228]
- Lin JK, Chien TW, Wang LY, Chou W. An artificial neural network model to predict the mortality of COVID-19 patients using routine blood samples at the time of hospital admission: Development and validation study. Medicine. 2021; 100(28):e26532. [DOI:10.1097/MD.0000000000026532] [PMID]
- Dhamodharavadhani S, Rathipriya R. COVID-19 mortality rate prediction for India using statistical neural networks and gaussian process regression model. African Health Sciences. 2021; 21(1):194-206. [DOI:10.4314/ahs.v21i1.26] [PMID]
- Tamang S, Singh P, Datta B. Forecasting of Covid-19 cases based on prediction using artificial neural network curve fitting technique. Global Journal of Environmental Science and Management. 2020; 6(Special Issue (Covid-19)):53-64. [Link]
- Mollalo A, Rivera KM, Vahedi B. Artificial neural network modeling of novel coronavirus (COVID-19) incidence rates across the continental United States. International Journal of Environmental Research and Public Health. 2020; 17(12):4204. [DOI:10.3390/ijerph17124204] [PMID]
- Shawaqfah M, Almomani F. Forecast of the outbreak of covid-19 using artificial neural network: Case study Qatar, Spain, and Italy. Results in Physics. 2021; 27:104484. [DOI:10.1016/j.rinp.2021.104484] [PMID]
Type of Study: Original Article |
Subject:
Infectious Diseases and Tropical Medicine
Send email to the article author
| Rights and permissions | |
 |
This work is licensed under a Creative Commons Attribution-NonCommercial 4.0 International License. |

This is an open access article distributed under the terms of the Creative Commons Attribution License (CC-By-NC), which permits use, distribution, and reproduction in any medium, provided the original work is properly cited and is not used for commercial purposes.
Contact Information
